Hi all!
I have a strange(but simple) problem that I seem to not be able to solve.
I have a timeseries database (QuestDB) that i interface with postgresql.
I want to make a query that groups by day the number of jobs executed that day.
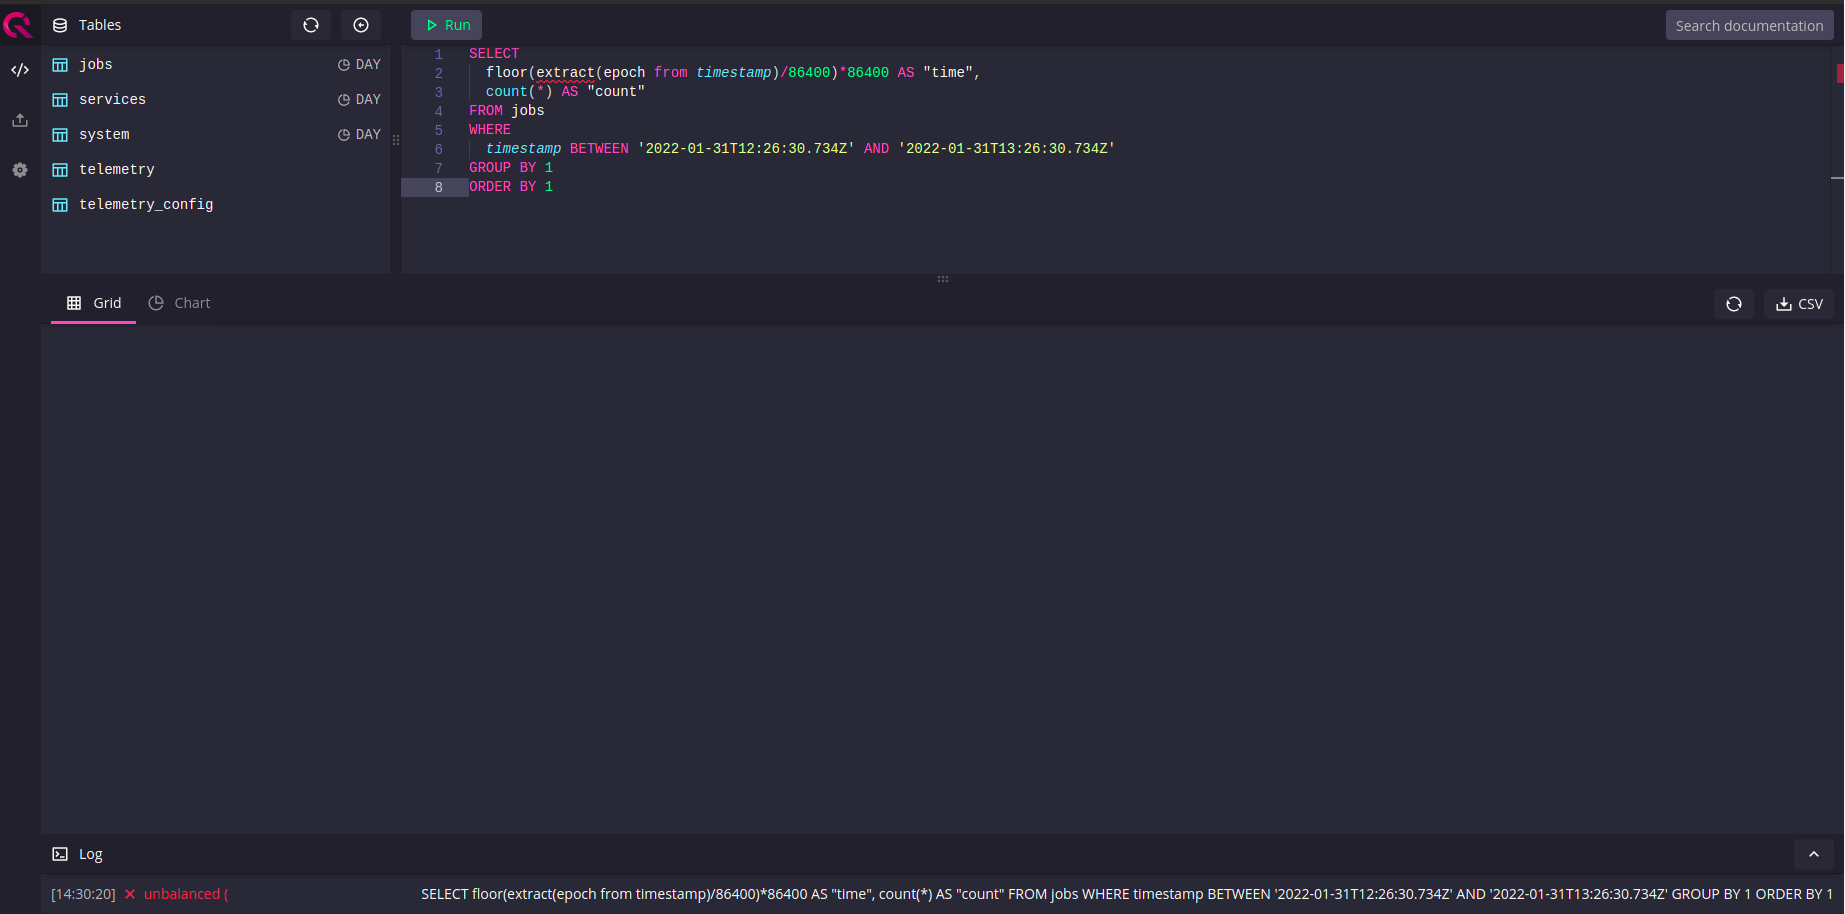
The query that i use is the one in Image 1 and the error i get is also shown in the Image 1
It looks like $__timeGroup creates some generated SQL that’s not yet supported. We don’t have the floor or extract functions yet. There is some documentation for using Grafana here which should help: Grafana | QuestDB: the database for time series.
What are you trying to achieve with timeGroup? You’re welcome to join our Slack workspace at http://slack.questdb.io/ if you like.
First of all thanks for the best timeseries DB and for helping me out.
I joined the slack channel.
To your question:
I’m trying to use Grafana chart called Bar Chart and create a table that i can use with it.
So i want to represent the number of jobs that were executed by month and divide them by what type they are.
So, I have my timestamp, JobType (that can be Analysis or FIPER). Since i cant use the timeGroup macro, how should i structure my query to get the right format for Bar Chart:
I use a “Time series” chart and I group by “day” and by “context” (in your case you can use GROUP BY MONTH(yourdatefield)) to obtain the following result.
It’s always a pleasure to brainstorm on such a topic.
I have other examples of bar charts, can you show us a result, in table form or csv, of your query to get an idea of your source for the chart?

 , QuestDB team member here.

