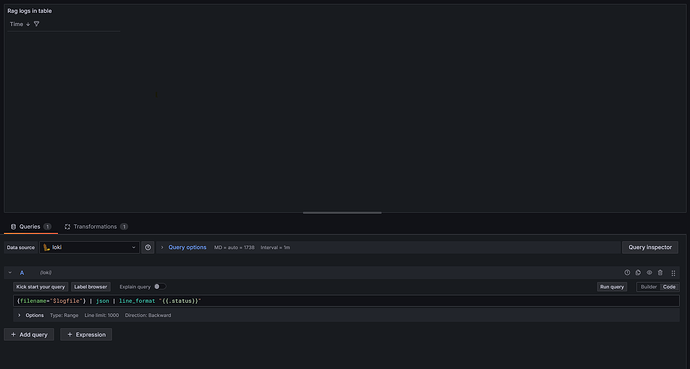
- What Grafana version and what operating system are you using?
Grafana v12.2.0 (92f1fba9b4) over Debian 13 Trixie. Grafana is running as a Docker image.
- What are you trying to achieve?
To modify the value of a Variable so that it correctly loads the Loki logs for the service Caddy.
- How are you trying to achieve it?
I’m editing the query value inside the Variables panel in the Dashboard. This is the Dashboard I’m currently trying to use: GitHub - Malfhas/caddy-grafana: Monitoring Caddy Server with Grafana (Prometheus + Loki) on Debian
- What happened?
The preview section showed caddy correctly. However, when I click the Run query button, nothing happens; I checked the Network tab in my browser and nothing is happening there. When going back to the Variables panel in the Dashboard settings, the Definition value is empty.
- What did you expect to happen?
I expected the logs to be shown in the proper tab in the Dashboard. I don’t know where the problem is, since using the same query in the Explore tab works fine.
- Can you copy/paste the configuration(s) that you are having problems with?
        "definition": "",
        "name": "logfile",
        "options": [],
        "query": {
          "label": "service_name",
          "refId": "LokiVariableQueryEditor-VariableQuery",
          "stream": "{service_name=\"caddy\"}",
          "type": 1
        },
        "refresh": 1,
        "regex": "",
        "type": "query"
- Did you receive any errors in the Grafana UI or in related logs? If so, please tell us exactly what they were.
No errors in Grafana UI or in related logs:
1759920565787 2025-10-08T10:49:25.787Z logger=tsdb.loki endpoint=queryData pluginId=loki dsName=loki dsUID=bf0d1pawx416ob uname=admin fromAlert=false t=2025-10-08T10:49:25.787030019Z level=info msg="Response received from loki" duration=7.698401ms stage=databaseRequest statusCode=200 contentLength= start=2025-10-08T10:44:25.652Z end=2025-10-08T10:49:25.652Z step=500ms query="{service_name=\"caddy\"} | json | logfmt | drop __error__, __error_details__ " queryType=range direction=backward maxLines=1000 supportingQueryType=grafana-lokiexplore-app lokiHost=loki:3100 lokiPath=/loki/api/v1/query_range status=ok
- Did you follow any online instructions? If so, what is the URL?
Didn’t follow any specific instructions, just the suggested values by Grafana. However, since it works in the Explore tab, I think it should work inside the Dashboard too, but I might be wrong.
Thanks in advance for any help!


