Logs disappear from Loki after some time

Hello everyone!

I have very irritating problem with Loki which I assume must be related to misconfiguration. The issue I struggle with is that after some time (usually it is approximately 30 minutes but sometimes it might take a few hours) logs disappear and only the recent ones are returned by the simple ‘take all’ query.

Below is the screenshot of log count chart taken just after loki and promtail initialization:

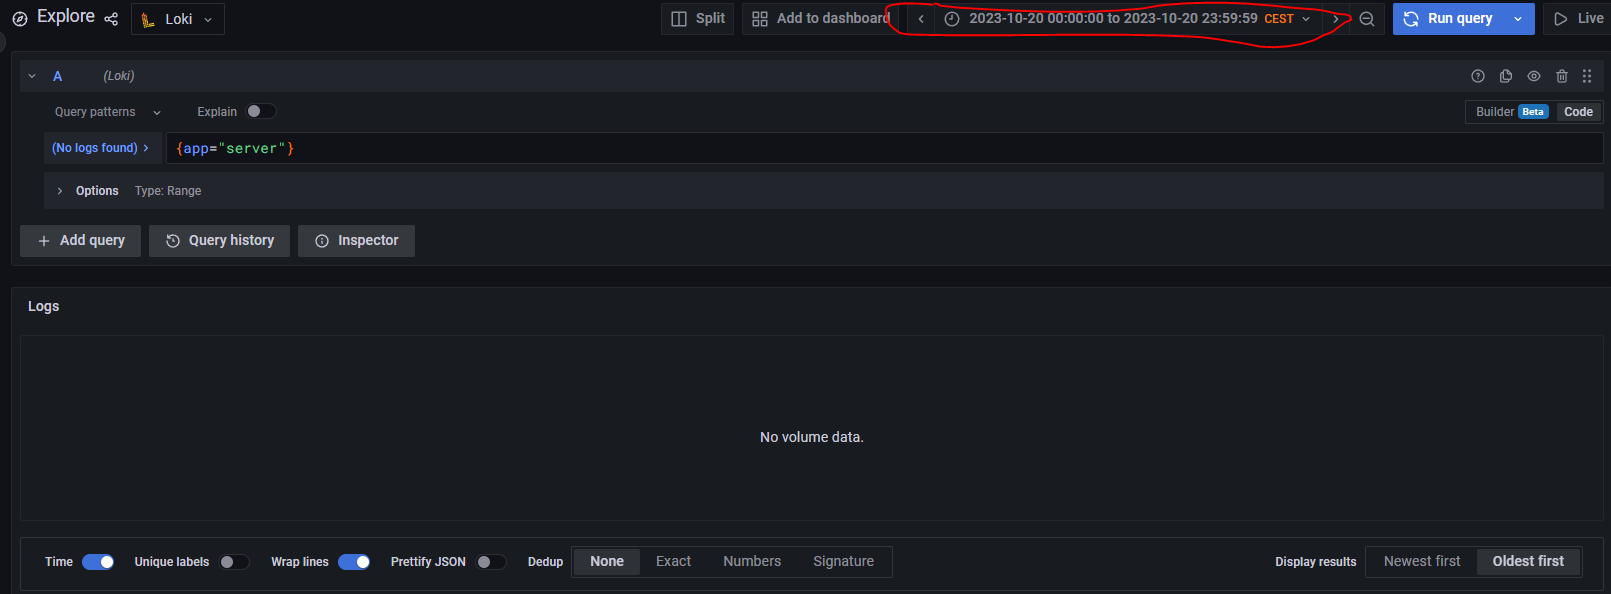
Following is taken two hours later:

My configuration seems to be quite simple; I have:

  • Promtail configured to follow one log file
  • Loki in monolithic mode configured to save data using filesystem

Both services are deployed using docker-compose.

Configuration files below (some sensitive data ‘obfuscated’):

docker-compose.yml

version: "3"

networks:
  grafana:
    external: true

services:
  promtail:
    image: dvp-docker.tools.finanteq.com/grafana/promtail:2.9.0
    privileged: true
    userns_mode: host
    volumes:
      - /var/log/apps:/var/log/apps
      - /opt/loki/config:/config
    command: -config.file=/config/promtail-config.yml
    networks:
      - grafana

  loki:
    image: dvp-docker.tools.finanteq.com/grafana/loki:2.9.0
    ports:
      - "3100:3100"
    volumes:
      - /opt/loki/config:/config
    command: -config.file=/config/loki-config.yml
    networks:
      - grafana

promtail-config.yml

clients:
  - url: http://loki:3100/loki/api/v1/push

scrape_configs:
- job_name: file_logs
  static_configs:
  - targets:
    - localhost
    labels:
      app: server
      __path__: /var/log/apps/application.log
  pipeline_stages:
  - match:
      selector: '{app="server"}'
      stages:
      - multiline:
          firstline: '^\[\d{4}-\d{2}-\d{2}\s\d{2}:\d{2}:\d{2},\d{3}\+\d{2}:\d{2}\]'
          max_wait_time: 3s
          max_lines: 100000 #single entry can be quite long
      - regex:
          expression: '^\[(?P<timestamp>\d{4}-\d{2}-\d{2}\s\d{2}:\d{2}:\d{2},\d{3}\+\d{2}:\d{2})\]\s(?P<level>[A-Z]{4,5})\s\[serverVersion:\s(?P<serverVersion>\d+\.\d+\.\d+(-SNAPSHOT)?)?\] (?P<message>(?s:.*))$' # shortened
      - labels: # not all labels
          level:
          serverVersion:
      - template:
          source: timestamp
          template: '{{ Replace .Value " " "T" 1}}'
      - template:
          source: timestamp
          template: '{{ Replace .Value "," "." 1}}'
      - timestamp:
          source: timestamp
          format: '2006-01-02T15:04:05.999-07:00'
      - structured_metadata: # not all metadata
          timestamp:
      - output:
          source: message

loki-config.yml

auth_enabled: false

server:
  grpc_server_max_recv_msg_size: 26214400 
  grpc_server_max_send_msg_size: 26214400 

limits_config:
  allow_structured_metadata: true
  max_line_size: 10kB
  max_line_size_truncate: true # for now I'm fine with truncating very big entries

common:
  path_prefix: /loki
  replication_factor: 1
  ring:
    kvstore:
      store: inmemory

schema_config:
  configs:
    - from: 2020-10-24
      store: tsdb
      object_store: filesystem
      schema: v13
      index:
        prefix: index_
        period: 24h

storage_config:
  tsdb_shipper:
    active_index_directory: /loki/tsdb-index
    cache_location: /loki/tsdb-cache
    shared_store: filesystem
  filesystem:
    directory: /loki/data

analytics:
  reporting_enabled: false

I searched through loki logs but there was really nothing that caught my attention. If you need them, I will gladly attach them.

I would be really grateful if anybody could point what might be the reason for this rather strange behaviour :pray:

Cheers!

Don’t see anything obviously wrong, but where is your data volume mount for the Loki container?

Volume is not there yet since I wanted to have clean chunk and index directories whenever I restarted container after some adjustments in config. I planned to add it as soon as everything else works as expected :slight_smile:

So did you check if container was not restarted?
How “take all” query looks like?

It has not been restarted - below excerpt from docker inspect command:

{
    ...
    "State": {
      "Status": "running",
      "Running": true,
      "Paused": false,
      "Restarting": false,
      "OOMKilled": false,
      "Dead": false,
      "Pid": 133920,
      "ExitCode": 0,
      "Error": "",
      "StartedAt": "2023-10-20T04:38:34.001250406Z",
      "FinishedAt": "0001-01-01T00:00:00Z"
    },
    ...
    "RestartCount": 0
    ...
}

When it comes to query, it is simply: {app="server"}

I guess you have limit on that query, e. g. 1000. You should use metric query (e. g. count log lines) and not obtain whole log lines, where anyway you will use only a count in the graph. It will be more effective.

I’m not sure I understand… Are we talking about line limit configured in Grafana?
image

If yes, how is that related to me not being able to fetch older logs after some time?

Correct. There is some auto limit, let’s say X. So blue and red sets contain the same count of lines (X):

That’s hypothesis and only you can prove it. Set high line limit (don’t use auto) and check time periods of these 2 graphs again.

Ok, I just did as you suggested. I could not perform it on the same time period as before because logs from then are not queryable anymore but I chose last 3 hours as time boundaries and below are results:

50 lines limit

5000 lines limit

I believe limit affects only number of log lines returned but not the count graph.

Just to add - the problem persists since logs from before 10:30 were present when I checked them around 11.

Please check metric query, e.g:

Hmmm, that is what I received:

OK, wrong query, better one:

sum(
  count_over_time(
    {
      app="server"
    }
    [$__interval]
  )
)

Ok, this is what I got:

How the same time range looks now?

Some logs already gone

There is another surprising behaviour that I noticed today in the morning - when I executed query spanning whole 20th of October (the day I started the container and the day I posted here), logs were returned:

But when I executed exactly the same query for the second time, they were already gone:

Ok, so that looks like a problem on the Loki side. :person_shrugging:

Do you suggest raising a bug on GitHub?

No, you should investigate and the observe problem.
E.g. check logs, observe pattern how logs disapear, time patterns, replicate on different machine,…

I am having the same issue. LMK if you have any additional information since your last post.