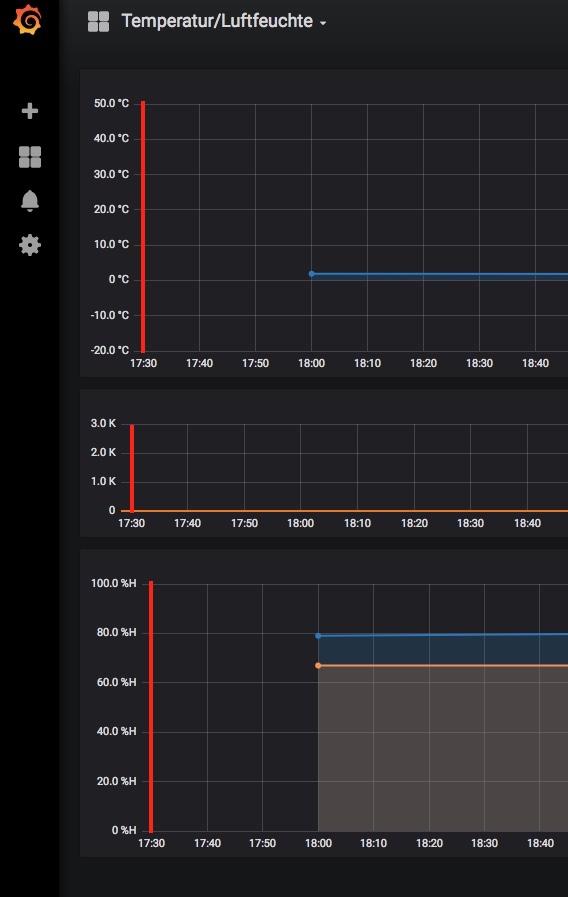
As you can see in the image I have 3 graphs. But because of different units on the Y-axis (which have different width e.g. 100.0 %H is wider than 50.0°C) the values on the X-Axis start at different positions (marked with the 3 red vertical lines).
Is there any way to line them up? I need something like ‘Legend unit width’ (similar to legend width)
Aligning the begin of the time axis between multiple graphs seems to be a paper cut feature request which is open since 2017. Here is the relevant Issue:
OK, just chipping in. Same minor wish for X/time axis alignments for various stacked panels.
Hint: Panel anchors for resize and positioning should be (optionally??) located at the min/max boundaries of the axis instead of the panel edges where legends and labels may required inconsistent space.
Ditto on this feature request. Would like to ensure we can have control over the rendering area of the graph inside the panel from the left side to ride side axes. This enable us to align the time axes of multiple related panes that share the same time axes.
In fact would be great to also show the vertical cursor bar at common times in all graphs on hover in one graph. We use Grafana to visualize our containerized ecosystem including Kafka, so there are lots of containers. We have separate panels showing docker container CPU use, memory use, and another one for data volume ingested. Would be nice than when hovering over 1 graph, we see the vertical bar at corresponding times in other panels. Makes it easier to see relationships.