Hi,
I am new to grafana.
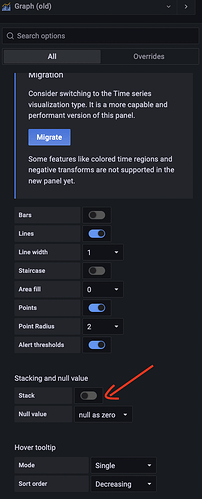
I am planning to show multiple graphs on the same panel. When I select all the graphs, they seem to be wrong. Even-though I select only one graph, it shows correctly.
Yellow line shows for ‘In Progress’ which ranges from 74 - 80.
Green line shows for ‘Done’ which ranges from 2400 - 2425.
When both graphs are present, it shows ‘In Progress’ line above the ‘Done’ line as below, but the mouse pointer shows the correct value.
Can someone help me on this.
Thanks in advance


