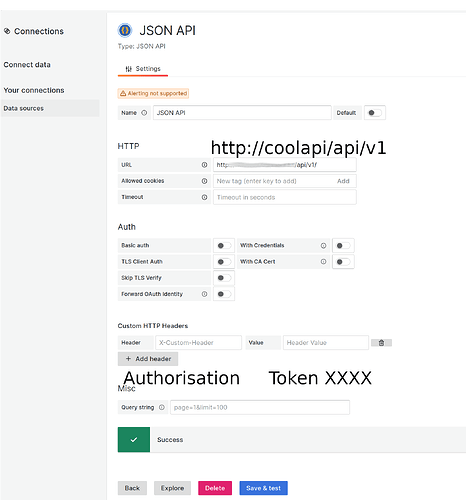
Greetings humans! I have a simple task: read an JSON API on another server and display the data in Grafana.
In the three images I do the following on a Grafana instance at, say, https://mygrafanaserver.com/.
- Install JSON API and set the URL (e.g. http://coolapi.com/api/v1/). API is on a different server.
- Create a panel and specify that datasource. I expect it to read http://coolapi.com/api/v1/devices. I set the fields to (e.g.) “name”. Go! But the response is from my Grafana server (all that html guff), not coolapi.com
- I check ‘network’ and see, yes, it’s requesting https://mygrafanaserver/api/v1.
I’m clearly an idiot: where am I going wrong?
Thanks!
ps. I must misunderstannd dataproxy as I expect the browser to ask /dataproxy/uid/… to make this request (i.e. from Grafana backend). But I see the request to the API in the browser.
pps. I’ve also tried checking CORS, different JSON datasources (infinity), removing auth p(I use a Token auth, but I think it’s not related)
Step 1
Step 2
Step 3


