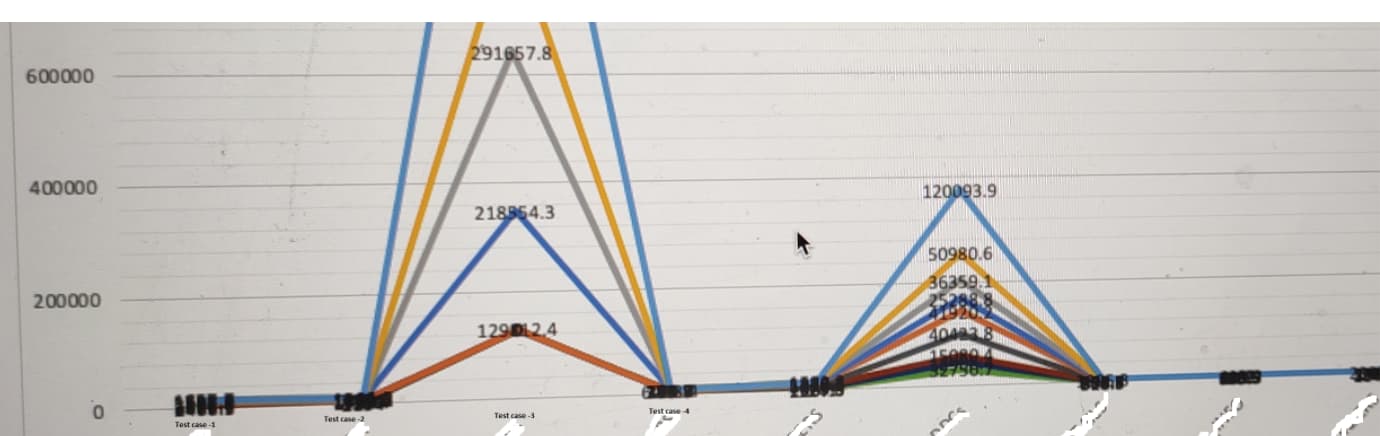
Is it possible to have user defined field along with time on x axis for trend graph. DB is influx. I wanted to plot performance graph for test suit.Y axis will have network parameter and x axis will show test case name and time. It’s possible in case of xls but how to draw it in grafana v7.3.1.
Expected Graph :-