Is it possible to graph array data?

Hi all,

I’m relatively new to Grafana but am getting the hang of it!

We’re utilising the JSON API plugin to pull in cpu/disk/memory metrics via a monitoring solution’s API. This is working nicely for most metrics apart from the individual core CPU usage history.

Unfortunately the JSON API doesn’t group data based on its parent object, so each CPU core’s utilisation samples’ timestamps and values are combined into a single table.

It’s ok! I’ll use one of the grouping options within grafana! -me. Using the Group by transformation on the time field, and then selecting All values for the sample data looks good! For each time stamp, each of the 32 cores individual samples are present. Perfect!

Unfortunately it won’t graph as the data is now in an array :frowning:

Ah, how about the Group by option in the Experimental tab? Group by time, matric as samples! Unfortunately this doesn’t work either. The time fields are displayed in the dropdown box under the table view but are no longer seen as timestamps and the metric isn’t shown anywhere:

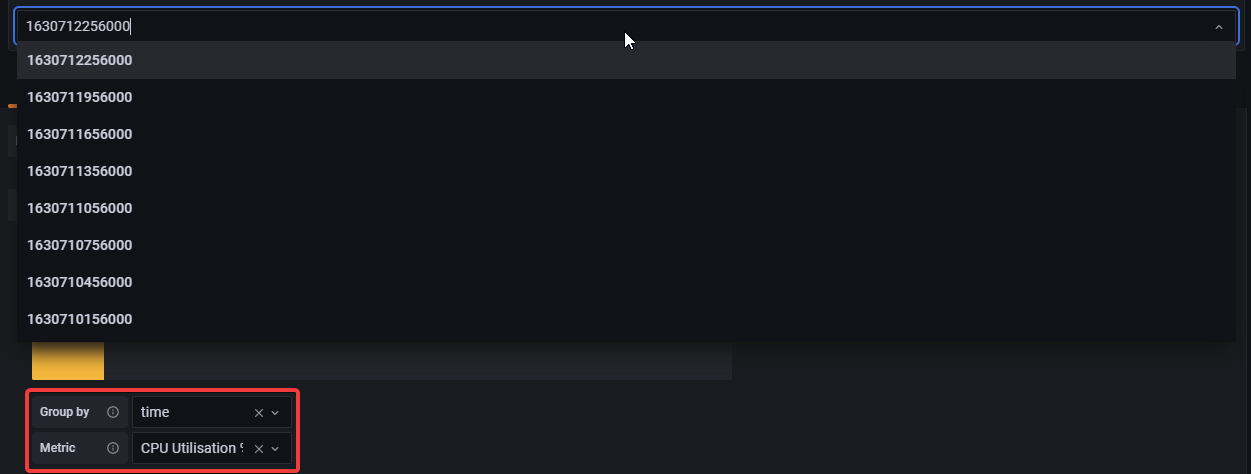
Switching off table view shows the Data does not have a time field error.

Is there any way to group by a timestamp and have the array data graphed? Any advice or recommendations would be greatly appreciated!

Cheers!

Hi @ideasman69

Thanks for sharing this. this is a fun and rather tricky problem.

TL:dr : I don’t think that one json response holds enough data to populate a graph the way you’d like it to (not without querying it more than once). Given the columnar-oriented nature of grafana’s time series panels, you would need to map each timestamp to each index in the array to create a series of pairs. So cpu1 = ("Time1, v1", "Time2, v2",...) and cpu2 = ("Time1, v1", "Time2, v2",...) and so on for each CPU.

I don’t see that happening using the grafana UI unless you hard-coded everything like this:
given this JSON:

{
  "cpu": [
    { "time": 1631745334, "usage": [95,12,2,2]},
    { "time": 1631745442, "usage": [94,10,1,1]},
    { "time": 1631745485, "usage": [94,6,1,1]}
    ]
}

you could do this, using the table panel to see the manipulations / and the merge transformation:

which results in this time series graph:

All that being said, this would be rather tedious with 32 cores and N number of time stamps, so I’d imagine then you be looking at some kind of scripting workaround, or changing the logic behind your JSON endpoint to, if you have access, to manipulate your values / reorganize the response data.

And at that point, you might want to consider a full TSDB like Prometheus, which is better designed to handle server metrics like this :+1:

Thanks for the reply! I kept focussing on it for a while but ended up getting it to work exactly as desired.

I posted about it on the JSON API github here: Can't get this JSON structure working · Discussion #164 · marcusolsson/grafana-json-datasource · GitHub

1 Like

This topic was automatically closed after 365 days. New replies are no longer allowed.