InfluxDB source: Data is missing a time field

  • Grafana 12.0.2, installed as container from image grafana/grafana-oss:latest on macOS
  • InfluxDB 2.7, installed as container from image influxdb:2.7.

Hi,

Being a total n00b with Grafana, please be forgiven about the level of this question. I try to integrate Grafana visualization with the open source project TSDuck and try to educate myself about Grafana.

I start with simple things, before getting more ambitious. I did a Grafana + InfluxDB setup using a dual-container and docker-compose, as documented online (exact procedure here if needed).

I get error “Data is missing a time field” trying to create a Flux query. The data do have a timestamp field. The problem is probably obvious but I couldn’t find an explanation.

Monitoring data are sent by the application to InfluxDB in this format:

bitrate,scope=ts,tsid=4 value=23722592 1750858324051
bitrate,scope=pid,pid=8191 value=0 1750858324051

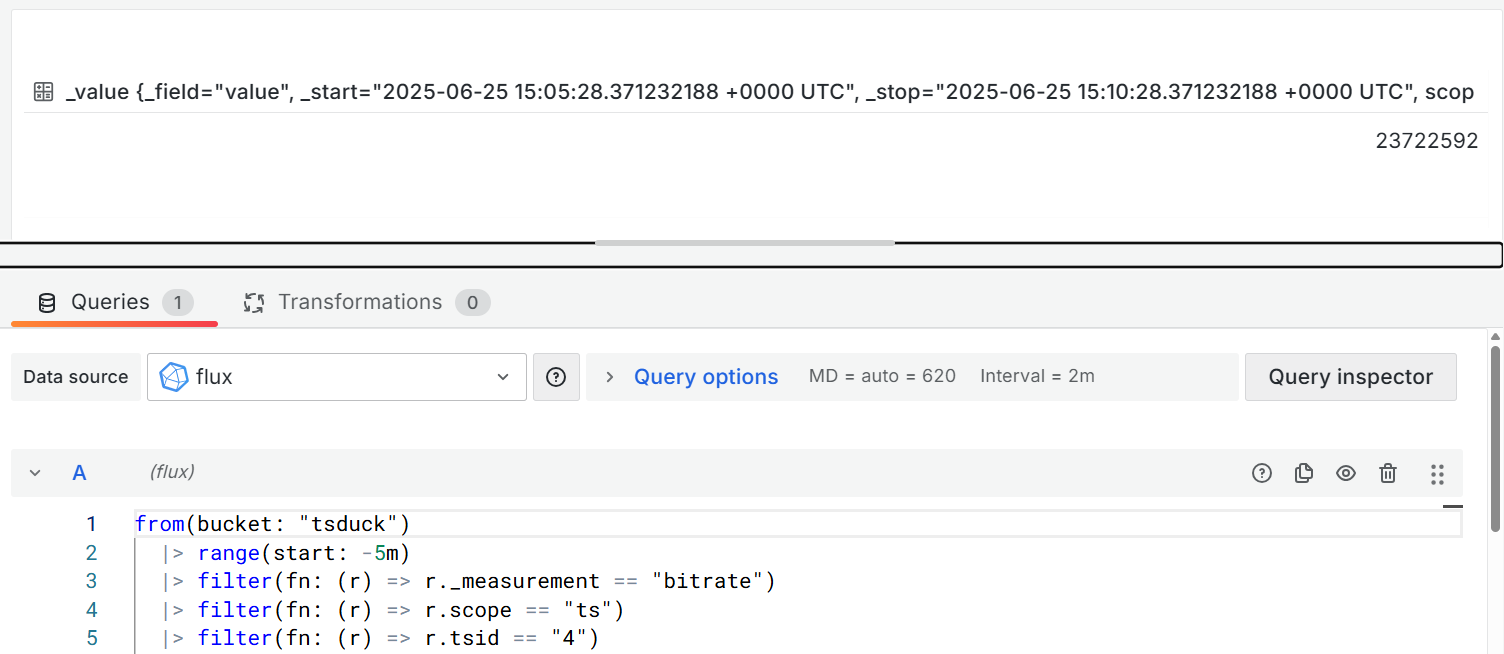
I select “Create dashboard”, “Add visualization”, select “influxdb (default)” as data source, enter a Flux query such as:

from(bucket: "demo-bucket")
  |> range(start: -5m)
  |> filter(fn: (r) => r._measurement == "bitrate")
  |> filter(fn: (r) => r.scope == "ts")
  |> filter(fn: (r) => r.tsid == "4")
  |> mean()

After hitting “Refresh”, I get “Data is missing a time field”.

Here is the content of the InfluxDB database (shrinked view with _start and _stop time removed);

$ influx query 'from(bucket:"demo-bucket") |> range(start:-20s)'
Result: _result
Table: keys: [_start, _stop, _field, _measurement, pid, scope]
_field:string  _measurement:string    pid:string  scope:string  _time:time  _value:float
-------------  -------------------  ------------  ------------  ----------  ------------
        value              bitrate          8191           pid  ...000000Z             0
        value              bitrate          8191           pid  ...000000Z             0
        value              bitrate          8191           pid  ...000000Z             0
        value              bitrate          8191           pid  ...000000Z             0
        value              bitrate          8191           pid  ...000000Z             0
        value              bitrate          8191           pid  ...000000Z             0
        value              bitrate          8191           pid  ...000000Z             0
        value              bitrate          8191           pid  ...000000Z             0
Table: keys: [_start, _stop, _field, _measurement, scope, tsid]
_field:string  _measurement:string  scope:string   tsid:string  _time:time  _value:float
-------------  -------------------  ------------  ------------  ----------  ------------
        value              bitrate            ts             4  ...000000Z      23549632
        value              bitrate            ts             4  ...000000Z      23758430
        value              bitrate            ts             4  ...000000Z      23736128
        value              bitrate            ts             4  ...000000Z      23735855
        value              bitrate            ts             4  ...000000Z      23759888
        value              bitrate            ts             4  ...000000Z      23720271
        value              bitrate            ts             4  ...000000Z      23752360
        value              bitrate            ts             4  ...000000Z      23725600

Thanks for your help.

Welcome to forum @lelegard

Excellent way of providing a solid question! So your mean() function is returning just one value and if you are using time series visualization, it will complain about missing time field

try this instead

from(bucket: "tsduck")
  |> range(start: v.timeRangeStart, stop: v.timeRangeStop)
  |> filter(fn: (r) => r["_measurement"] == "bitrate")
  |> filter(fn: (r) => r.scope == "ts")
  |> filter(fn: (r) => r.tsid == "4")
  |> aggregateWindow(every: v.windowPeriod, fn: mean, createEmpty: false)
  |> yield(name: "mean")
2 Likes

Thanks @yosiasz, that’s much better !

I will read the docs to understand each part of your request and try to build more ambitious reports.

One final question. What is the difference between r._measurement (my original request) and r["_measurement"] (your modified request)? Especially because you kept the dot notation in other fields such as r.scope.

The difference lies in the syntax for accessing record properties:

  • r._measurement (Dot Notation): This is the more common and generally preferred way to access properties of a record in Flux. It’s concise and easy to read, similar to accessing properties in many other programming languages. You use dot notation when the property name is a valid identifier (i.e., it doesn’t contain spaces, special characters, or start with a number).
  • r["_measurement"] (Bracket Notation): This notation is used when the property name contains special characters (like _ in _measurement, _field, _value, etc., although dot notation does work for these standard InfluxDB columns).
    • Use bracket notation to access keys with special or whitespace characters.

In the specific case of _measurement (and _field, _value, _time, _start, _stop), both dot notation and bracket notation are valid and produce the same result. InfluxDB’s built-in columns are designed to work smoothly with dot notation despite their leading underscores.

2 Likes

Thank you @grant2, this is clear.