Hello dear community,
I have the following problem in all my dashboards with the display on the X axis. I would like the days or the date to be displayed continuously on the X-axis. Unfortunately, for me, some days or dates are displayed twice or more than once.
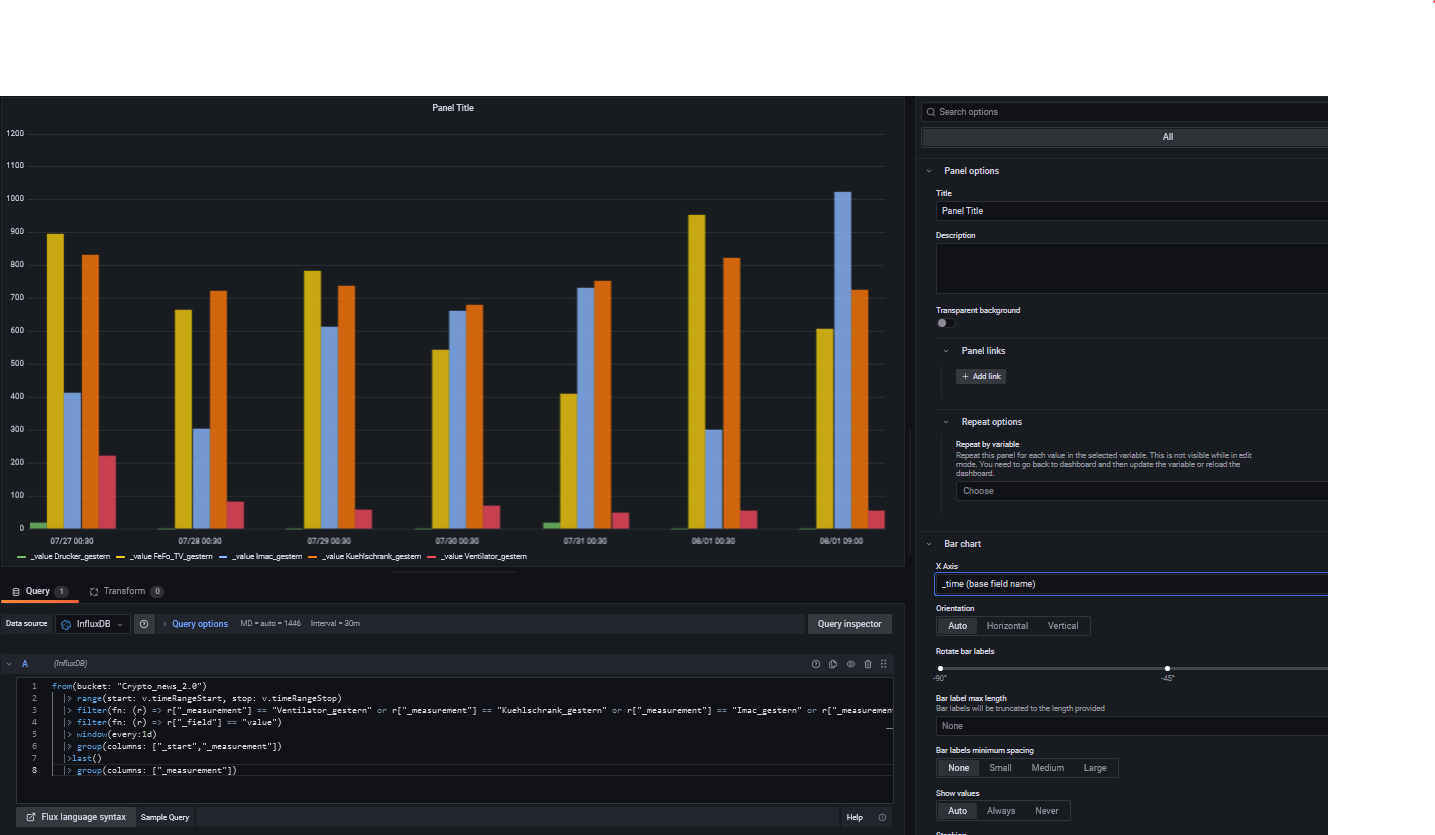
I have uploaded a screenshot here as an example so that you can see exactly what I mean.
How do I get it to show only one date on the x-axis? I’ve already tried everything possible, but I can’t get it. Unfortunately, I don’t know anything about script commands.
Can you please explain to me how I can do that.
Greetings Andy
Could you please provide an export of that data as csv or provide them here inline something similar to this (obfuscated of course)
table,_start,_stop,_time,_value,_field,_measurement,uic
0,2022-07-08T23:26:22.938437362Z,2022-07-08T23:27:22.938437362Z,2022-07-08T23:26:24Z,494,gpsaltitude,test,111
0,2022-07-08T23:26:22.938437362Z,2022-07-08T23:27:22.938437362Z,2022-07-08T23:26:25Z,494,gpsaltitude,test,111
0,2022-07-08T23:26:22.938437362Z,2022-07-08T23:27:22.938437362Z,2022-07-08T23:26:26Z,494,gpsaltitude,test,111```
I would like to do that, but I don’t know how to create such a .csv. For me it looks completely different than your example.
I use Grafana 8.5.5
That was just a sample. You can just type it here in the forum or go to influxdb and dowbload it as csv after you run the same query you are showing us here
basically the issue seems to be you have 2 readings per day. and they seem to be identical readings to the naked eye 
Okay, here is the download from my infux
#group	false	false	true	true	false	false	true	true
#datatype	string	long	dateTime:RFC3339	dateTime:RFC3339	dateTime:RFC3339	double	string	string
#default	mean
	result	table	_start	_stop	_time	_value	_field	_measurement
		0	2022-07-26T19:48:12.136000766Z	2022-08-02T19:48:12.136000766Z	2022-07-26T22:30:00Z	18.15	value	Drucker_gestern
		0	2022-07-26T19:48:12.136000766Z	2022-08-02T19:48:12.136000766Z	2022-07-27T22:30:00Z	0	value	Drucker_gestern
		0	2022-07-26T19:48:12.136000766Z	2022-08-02T19:48:12.136000766Z	2022-07-28T22:30:00Z	0	value	Drucker_gestern
		0	2022-07-26T19:48:12.136000766Z	2022-08-02T19:48:12.136000766Z	2022-07-29T11:00:00Z	0	value	Drucker_gestern
		0	2022-07-26T19:48:12.136000766Z	2022-08-02T19:48:12.136000766Z	2022-07-29T22:30:00Z	0	value	Drucker_gestern
		0	2022-07-26T19:48:12.136000766Z	2022-08-02T19:48:12.136000766Z	2022-07-30T21:00:00Z	0	value	Drucker_gestern
		0	2022-07-26T19:48:12.136000766Z	2022-08-02T19:48:12.136000766Z	2022-07-30T22:30:00Z	19.13	value	Drucker_gestern
		0	2022-07-26T19:48:12.136000766Z	2022-08-02T19:48:12.136000766Z	2022-07-31T22:30:00Z	0	value	Drucker_gestern
		0	2022-07-26T19:48:12.136000766Z	2022-08-02T19:48:12.136000766Z	2022-08-01T07:00:00Z	0	value	Drucker_gestern
		1	2022-07-26T19:48:12.136000766Z	2022-08-02T19:48:12.136000766Z	2022-07-26T22:30:00Z	894.4	value	FeFo_TV_gestern
		1	2022-07-26T19:48:12.136000766Z	2022-08-02T19:48:12.136000766Z	2022-07-27T22:30:00Z	664.41	value	FeFo_TV_gestern
		1	2022-07-26T19:48:12.136000766Z	2022-08-02T19:48:12.136000766Z	2022-07-28T22:30:00Z	783.93	value	FeFo_TV_gestern
		1	2022-07-26T19:48:12.136000766Z	2022-08-02T19:48:12.136000766Z	2022-07-29T11:00:00Z	783.93	value	FeFo_TV_gestern
		1	2022-07-26T19:48:12.136000766Z	2022-08-02T19:48:12.136000766Z	2022-07-29T22:30:00Z	543.48	value	FeFo_TV_gestern
		1	2022-07-26T19:48:12.136000766Z	2022-08-02T19:48:12.136000766Z	2022-07-30T21:00:00Z	543.48	value	FeFo_TV_gestern
		1	2022-07-26T19:48:12.136000766Z	2022-08-02T19:48:12.136000766Z	2022-07-30T22:30:00Z	409.65	value	FeFo_TV_gestern
		1	2022-07-26T19:48:12.136000766Z	2022-08-02T19:48:12.136000766Z	2022-07-31T22:30:00Z	953.22	value	FeFo_TV_gestern
		1	2022-07-26T19:48:12.136000766Z	2022-08-02T19:48:12.136000766Z	2022-08-01T07:00:00Z	953.22	value	FeFo_TV_gestern
		1	2022-07-26T19:48:12.136000766Z	2022-08-02T19:48:12.136000766Z	2022-08-01T22:30:00Z	606.02	value	FeFo_TV_gestern
		2	2022-07-26T19:48:12.136000766Z	2022-08-02T19:48:12.136000766Z	2022-07-26T22:30:00Z	413.7	value	Imac_gestern
		2	2022-07-26T19:48:12.136000766Z	2022-08-02T19:48:12.136000766Z	2022-07-27T22:30:00Z	302.4	value	Imac_gestern
		2	2022-07-26T19:48:12.136000766Z	2022-08-02T19:48:12.136000766Z	2022-07-28T22:30:00Z	612.64	value	Imac_gestern
		2	2022-07-26T19:48:12.136000766Z	2022-08-02T19:48:12.136000766Z	2022-07-29T11:00:00Z	612.64	value	Imac_gestern
		2	2022-07-26T19:48:12.136000766Z	2022-08-02T19:48:12.136000766Z	2022-07-29T22:30:00Z	662.4	value	Imac_gestern
		2	2022-07-26T19:48:12.136000766Z	2022-08-02T19:48:12.136000766Z	2022-07-30T21:00:00Z	662.4	value	Imac_gestern
		2	2022-07-26T19:48:12.136000766Z	2022-08-02T19:48:12.136000766Z	2022-07-30T22:30:00Z	730.17	value	Imac_gestern
		2	2022-07-26T19:48:12.136000766Z	2022-08-02T19:48:12.136000766Z	2022-07-31T22:30:00Z	300.96	value	Imac_gestern
		2	2022-07-26T19:48:12.136000766Z	2022-08-02T19:48:12.136000766Z	2022-08-01T07:00:00Z	300.96	value	Imac_gestern
		2	2022-07-26T19:48:12.136000766Z	2022-08-02T19:48:12.136000766Z	2022-08-01T22:30:00Z	1021.44	value	Imac_gestern
		3	2022-07-26T19:48:12.136000766Z	2022-08-02T19:48:12.136000766Z	2022-07-26T22:30:00Z	832.73	value	Kuehlschrank_gestern
		3	2022-07-26T19:48:12.136000766Z	2022-08-02T19:48:12.136000766Z	2022-07-27T22:30:00Z	722.04	value	Kuehlschrank_gestern
		3	2022-07-26T19:48:12.136000766Z	2022-08-02T19:48:12.136000766Z	2022-07-28T22:30:00Z	736.38	value	Kuehlschrank_gestern
		3	2022-07-26T19:48:12.136000766Z	2022-08-02T19:48:12.136000766Z	2022-07-29T11:00:00Z	736.38	value	Kuehlschrank_gestern
		3	2022-07-26T19:48:12.136000766Z	2022-08-02T19:48:12.136000766Z	2022-07-29T22:30:00Z	681.73	value	Kuehlschrank_gestern
		3	2022-07-26T19:48:12.136000766Z	2022-08-02T19:48:12.136000766Z	2022-07-30T21:00:00Z	681.73	value	Kuehlschrank_gestern
		3	2022-07-26T19:48:12.136000766Z	2022-08-02T19:48:12.136000766Z	2022-07-30T22:30:00Z	752.04	value	Kuehlschrank_gestern
		3	2022-07-26T19:48:12.136000766Z	2022-08-02T19:48:12.136000766Z	2022-07-31T22:30:00Z	823.55	value	Kuehlschrank_gestern
		3	2022-07-26T19:48:12.136000766Z	2022-08-02T19:48:12.136000766Z	2022-08-01T07:00:00Z	823.55	value	Kuehlschrank_gestern
		3	2022-07-26T19:48:12.136000766Z	2022-08-02T19:48:12.136000766Z	2022-08-01T22:30:00Z	724.55	value	Kuehlschrank_gestern
		4	2022-07-26T19:48:12.136000766Z	2022-08-02T19:48:12.136000766Z	2022-07-26T22:30:00Z	221.5	value	Ventilator_gestern
		4	2022-07-26T19:48:12.136000766Z	2022-08-02T19:48:12.136000766Z	2022-07-27T22:30:00Z	83.53	value	Ventilator_gestern
		4	2022-07-26T19:48:12.136000766Z	2022-08-02T19:48:12.136000766Z	2022-07-28T22:30:00Z	57.6	value	Ventilator_gestern
		4	2022-07-26T19:48:12.136000766Z	2022-08-02T19:48:12.136000766Z	2022-07-29T11:00:00Z	57.6	value	Ventilator_gestern
		4	2022-07-26T19:48:12.136000766Z	2022-08-02T19:48:12.136000766Z	2022-07-29T22:30:00Z	71.77	value	Ventilator_gestern
		4	2022-07-26T19:48:12.136000766Z	2022-08-02T19:48:12.136000766Z	2022-07-30T21:00:00Z	71.77	value	Ventilator_gestern
		4	2022-07-26T19:48:12.136000766Z	2022-08-02T19:48:12.136000766Z	2022-07-30T22:30:00Z	49.26	value	Ventilator_gestern
		4	2022-07-26T19:48:12.136000766Z	2022-08-02T19:48:12.136000766Z	2022-07-31T22:30:00Z	54.1	value	Ventilator_gestern
		4	2022-07-26T19:48:12.136000766Z	2022-08-02T19:48:12.136000766Z	2022-08-01T07:00:00Z	54.1	value	Ventilator_gestern
		4	2022-07-26T19:48:12.136000766Z	2022-08-02T19:48:12.136000766Z	2022-08-01T22:30:00Z	55.38	value	Ventilator_gestern
So that now I have your data in my influxdb (avoids the back and forth questions/confusions) What do you want grafana to do with these?
same date different data.
I would like to display the daily power consumption in Grafana, but only have one date on the x-axis, then the next, etc. It bothers me that some dates appear several times on the X-axis and I hope that you can adjust it so that each date only appears once. I hope I have made myself clear.
Thank you for your help.
so from the given data sample, where 2 appear per day, which one do you want? The smallest, average, largest?
I want the small like 07/29 07/30 07/31
Again, there are 2 values still with that date format which of these values, do you want to keep and plot
Your initial issue was 2 of the same dates plotted. So even if you changed that format it won’t exclude the second value
Just changing the date format won’t magically fix the issue of 2 values in ssme date
Sorry, but now it’s getting a little too complicated for me. I honestly admit that. If there is a possibility that only one date is displayed on the x-axis, I would follow your suggested solution, since I also have the problem in other dashboards.
@yosiasz @damrak2022
i think if you only want one value by day you can still group by day and use
|>last() function to get last value of each group
@alexandrearmand can you try that theory out using the data provided by @damrak2022 ? Here is a python script way of importing that csv
import pandas as pd
from influxdb_client import InfluxDBClient, Point, WritePrecision, WriteOptions
from influxdb_client.client.write_api import SYNCHRONOUS
from datetime import datetime
from dotenv import load_dotenv
import os
load_dotenv()

URL = os.getenv('URL')
TOKEN = os.getenv('TOKEN')
ORG = os.getenv('ORG')

bucket = "DBANDY1"

"""
Write data into InfluxDB
"""
client = InfluxDBClient(url=URL, token=TOKEN, org=ORG, debug=True)
write_api = client.write_api(write_options=SYNCHRONOUS)

col_list = ["_time","_value","_field","_measurement"]
df = pd.read_csv("./data/dammrak.csv", usecols=col_list)

for index, row in df.iterrows():
    _time =  row['_time']
    _field =  row['_field']
    _measurement =  row['_measurement']
    _value = int(row['_value'])

    point = Point(_measurement) \
            .field(_field, _value) \
            .time(_time, WritePrecision.NS)

    write_api.write(bucket, ORG, point)
write_api.__del__()

"""
Close client
"""
client.__del__()
here is my result :
with this query :
from(bucket: "DBANDY1")
  |> range(start: v.timeRangeStart, stop: v.timeRangeStop)
  |> filter(fn: (r) => r["_measurement"] == "Ventilator_gestern" or r["_measurement"] == "Kuehlschrank_gestern" or r["_measurement"] == "Imac_gestern" or r["_measurement"] == "FeFo_TV_gestern" or r["_measurement"] == "Drucker_gestern")
  |> filter(fn: (r) => r["_field"] == "value")
  |> window(every: 1d)
  |> group(columns: ["_start","_measurement"])
  |>last()
  |> group(columns: ["_measurement"])
equivalent to this single line
|> aggregateWindow(every: 1d, fn: sum)
edit : this is _stop field to get coherent Xaxis
i think you should check time series panel too with this kind of query ,
don’t you like think of stacked bar , you can see sum of all by one look
awesome! now filter down to FeFo_TV_gestern by clicking on legend and hover over values on 7/29 and post back please
Thanks!
Thanks again for your help. Since I translate everything with Google Translator, I may not have fully understood it yet.
In any case, I like the first panel better, where the bars are visible next to each other.
If I understand correctly, then I have to use this query
from(bucket: “DBANDY1”)
|> range(start: v.timeRangeStart, stop: v.timeRangeStop)
|> filter(fn: (r) => r[“_measurement”] == “Fan_yesterday” or r[“_measurement”] == “Fridge_yesterday” or r[“_measurement”] == “Imac_yesterday” or r[" _measurement"] == “FeFo_TV_yesterday” or r[“_measurement”] == “Printer_yesterday”)
|> filter(fn: (r) => r[“_field”] == “value”)
|> window(every: 1d)
|> group(columns: [“_start”,“_measurement”])
|>last()
|> group(columns: [“_measurement”])
And then, after customizing it, I can apply that to my other boards too, where I only want to have a date on the x-axis.
I’ll try that right now.
Now I’ve inserted the query and validated it with Appy and now my chart looks like this. Apparently I’ve done something terribly wrong here, or where is my mistake
Could you please be so kind and post me the entire code, which I then have to insert in the query. Then I would have a base that I could write down to adapt to other boards. That was really nice of you