I’m trying to get some information into Grafana which I’m done many times. Here I’m using telegraf to poll a single router and send the data to InfluxDB, which you can see here is working:
Telegraf:
Telegraf file

Influx:
Chronograf:

Now here is the issue, I create a datasource to Influx and try and build a graph and it finds nothing:

I did put a username and password on the influxdb but it seems Grafana doesn’t care:

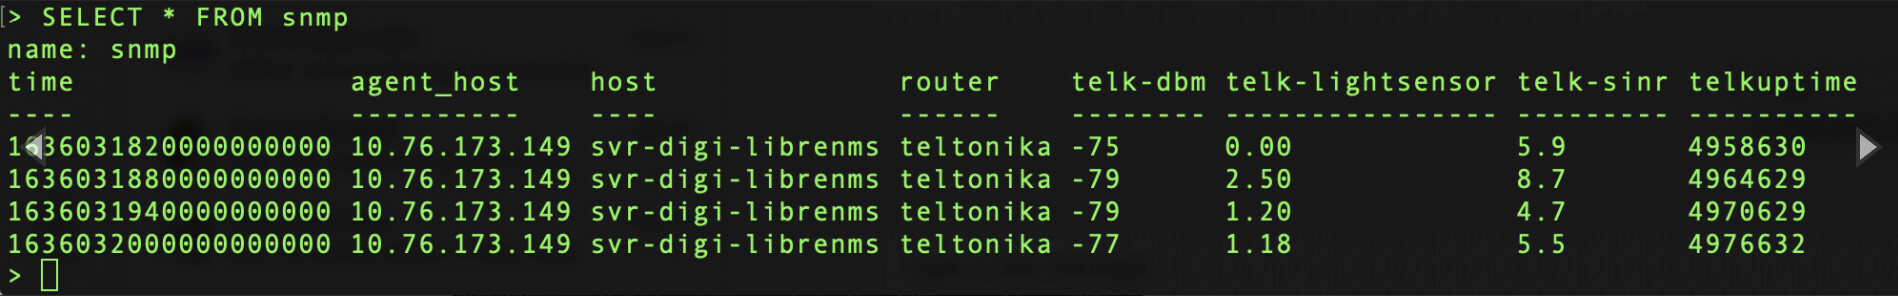
Now I try a graph:

Also it seems to find my tag, but nothing after too:

What could be the issue?