- What Grafana version and what operating system are you using?
- What are you trying to achieve?
I’d like to show a history of test cases in our CI/CD (Azure DevOps) pipelines. I have transformed from Azure DevOps pipelines into dedicated data source MSSQL database.
There I have some tables for: build definition, build, test run, test case, test results.
I’m able to create queries that would show results of test cases for specific build definition for multiple builds in some time period.
I’d like to visualize this in Grafana. As I’ve seen your introduction to State Timeline Panel on YouTube: https://www.youtube.com/watch?v=a9wZHM0mdxo&t=155s
I wanted to try it out. However, I don’t have a static “CSV” file with predetermined “Server A” and “Server B”, but I have time or build names. Meaning, that I have a dynamic number of columns - not just two as shown in demo video.
Additionally, I have many tests and builds which I would like to show (100+ test cases, 30+ builds). Test result means - passed/failed - integer values which I could map to “passed”/“failed” strings.
What visualization panels and transformation should I tried out to achieve this scenario?
Do you have similar examples somewhere available to see how they are created?
- How are you trying to achieve it?
I’ve tried to pivot the timestamp/builds into columns for state timeline visualization - Grouping to Matrix transformation.
There is complain that the rows are not time (I want test cases names as rows)
- What did you expect to happen?
See “What** are you trying to achieve?”
-
Can you copy/paste the configuration(s) that you are having problems with?
-
Did you receive any errors in the Grafana UI or in related logs? If so, please tell us exactly what they were.
-
Did you follow any online instructions? If so, what is the URL?
https://www.youtube.com/watch?v=a9wZHM0mdxo&t=155s
Guidance and support in this regard would be highly appreciated.
welcome @adronius
thanks for very thorough explanation. we dont have access to your db so please provide table schema and column data types and maybe some sample data
Here is a description of the tables:
BuildDefinitions
Builds
- ID (BigInt)
- Name (VarChar)
- Branch (VarChar)
- BuildDefinitionID (Int) - one BuildDefinition have multiple Builds
- StartDate (DateTime)
- EndDate (DateTime)
TestRuns
- ID (BigInt)
- BuildID (BigInt) - one Build have multiple TestRuns
TestResults
- ID (BigInt)
- TestCaseID (UniqueIdentifier) - mapping to test case - one TestCase could have multiple TestResults (in time)
- TestRunID (BigInt) - one TestRun have multiple TestResults
- OutcomeID (Int) - result of the test case, e.g., 1 - passed, 2 - failed, 3 - aborted, 4 - not executed
- StartDate (DateTime)
- EndDate (DateTime)
TestCases
- ID (UniqueIdentifier)
- Name (VarChar)
- … some other not important for the use case
Example:
For build definition called “BuildDefinitionXY” which has multiple builds in the last 7 days:
“Build1”, “Build2”,…“Build7”, and each build could have a multiple test runs, but they have mostly the same set of test cases (e.g., Nightly Builds).
I’d like to visualize in Grafana test results for test cases which failed at least once during the time window - ignoring test that were always passed. And for these tests to see their results in all builds (for that time window) so that I can easily - visually identify tests that could be flaky (F, P, F, P, F…) or stable failed (F, F, F, …), to also see how long some tests were failed.
However, the example in YouTube tutorial works only with two static columns (Server A, Server B), but in my case, I have dynamic list of Builds and their names.
Is it possible to do something like that in Grafana? If yes, which visualization is best for this scenario and maybe also which transformations should be used to enable this use case?
Thank you very much.
yes that is doable. which data points do you want to plot in your visualization?
I would like to see the results of the test cases in time for multiple builds.
So something like State Timeline, Status History or Table in which the rows would be the test case names, and column names would be the build names or build start date and the cell value would be the test result’s OutcomeID mapped to “passed”, “failed”, …
select  tc.Name 'Test Case Name',
        b.Name 'Build Name',
		--b.Branch, b.StartDate 'Build Start Date',  b.EndDate 'Build End Date',tre.EndDate 'Test Result End Date', tre.StartDate 'Test Result Start Date',
		--bd.Name 'Build Definition Name',
		case
		  when tre.OutcomeID = 1 then  'Passed'
		  when tre.OutcomeID = 2 then  'Failed'
		 else 'aborted'
		end as 'Outcome'
		--1 - passed, 2 - failed, 3 - aborted,

 from BuildDefinitions bd
 join builds b on bd.ID = b.BuildDefinitionID
 join TestRuns tr on tr.BuildID = b.ID
 join TestResults tre on tre.TestRunID = tr.ID
 join TestCases tc on tc.ID = tre.TestCaseID
using Transform
Thank you very much! I’m able to achieve the same results in Table panel.
Is there a way to rotate column header name 90 degrees, so that the column width stays small and still I would be able to see longer column header? I’d like to see the build name, but it’s longer.
For many builds I can use the mapping “P”, “F” for passed, failed test results to keep the cell value short.
To achieve similar results, I tried to use just “MM-dd” datetime formatting to make column shorter:

(test case names are ommited from the screenshot)
However, if I want to use a State Timeline with the same query and transformation I get: “Data does not have a time field”. Same message for a Status History panel.
Is there a way how to see “how long the test is failed” based on the test result’s “StartDate”?
Similarly to picture:
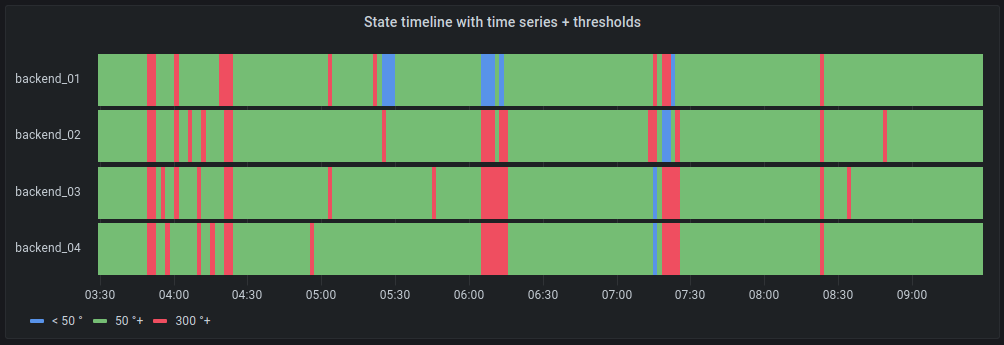
but instead of hardcoded list of “backends” I would have dynamic/queried list of test cases.
“how long” is a singular metric value ie minutes/hours but the other vizs are complaining about date time. So which viz do you want to use?
I don’t know which one is possible. Let’s say State Timeline panel. How could I incorporate test result’s start date time into the query and show it in the panel?


