I’d like to stack 4 values into one bar like in the following picture:

I made X-axis as SW version so I put X-Axis as ‘Series’ mode’.
However I had to use “Then by, Date Histogram, lastUpdatedDatetime” in the end.
My Graph so far is (2 values not 4 values though):
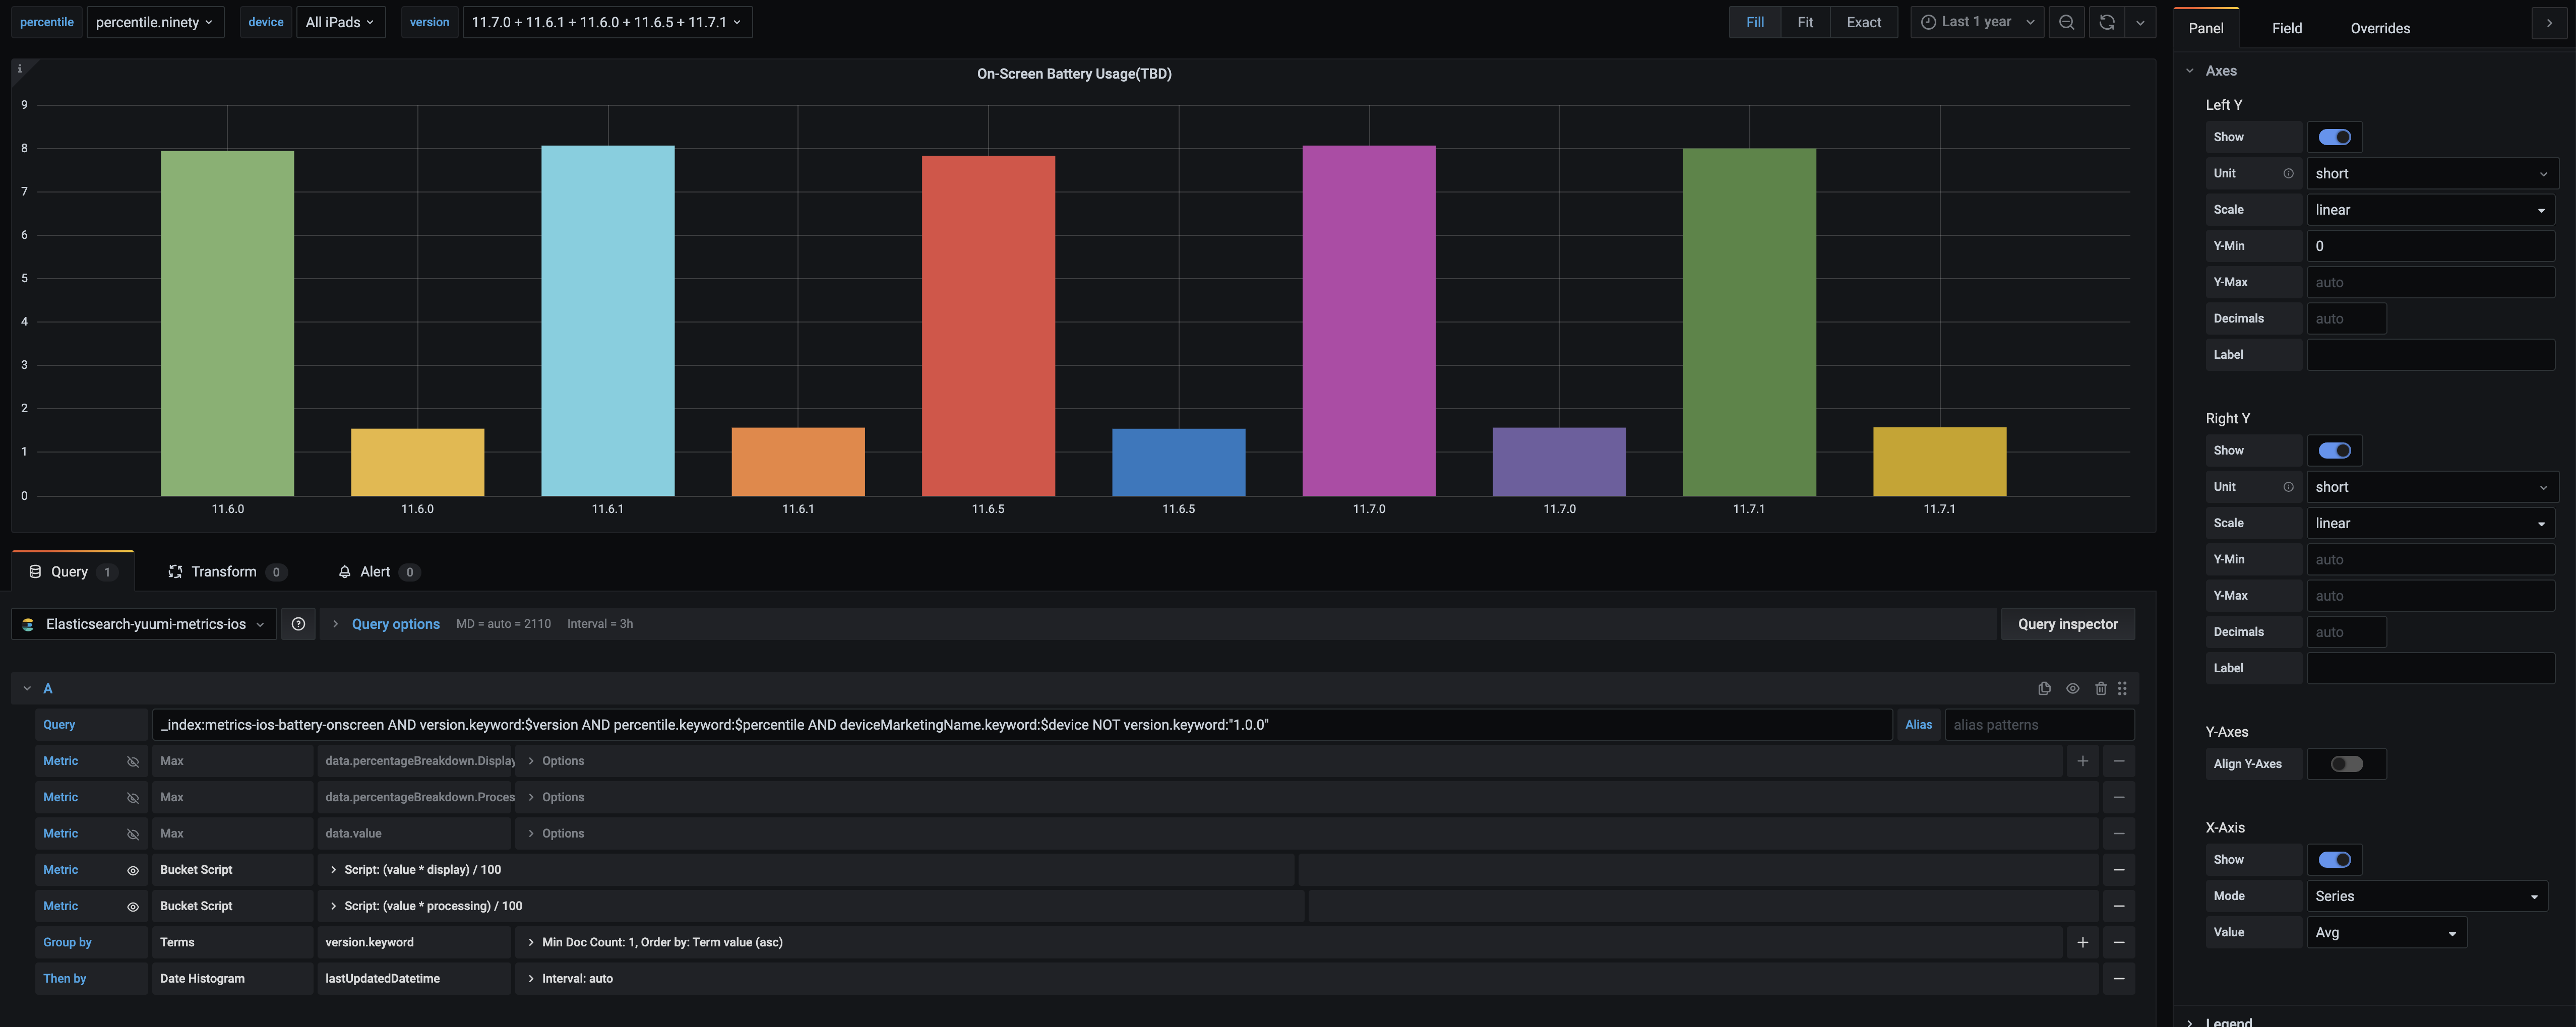
The left bar of each version is calculated ‘display’ value, and the right bar is for ‘processing’ value.
I already turned on
Stack switch in the Display Panel, but it didn’t made any change.
And my raw data looks like this:
{
  "_index": "metrics-ios-battery-onscreen",
  "_type": "_doc",
  "_id": "11.8.2-percentile.ninety-iPhone10,1",
  "_version": 10,
  "_score": 5.8176126,
  "_source": {
    "version": "11.8.2",
    "percentile": "percentile.ninety",
    "device": "iPhone10,1",
    "deviceMarketingName": "iPhone 8",
    "data": {
      "value": 14.01,
      "percentageBreakdown": {
        "Display": {
          "value": 39
        },
        "Processing": {
          "value": 43
        },
        "Audio": {
          "value": 2
        },
        "Camera": {
          "value": 0
        },
        "Torch": {
          "value": 0
        },
        "Networking": {
          "value": 13
        },
        "Bluetooth": {
          "value": 0
        },
        "NFC": {
          "value": 0
        },
        "Location": {
          "value": 0
        }
      }
    },
    "lastUpdatedDatetime": "2021-05-28T06:06:28.975767+00:00"
  }```