I don’t know how to show annotations in a table panel in Grafana 7.x
Can somebody help me with complete screenshots for the settings?
I want to show the annotations from datasource – Grafana –
2 Likes
I’ve found a temporary solution for me:
Annotation JSON from Grafana 6.x
{
  "datasource": "-- Grafana --",
  "columns": [],
  "fontSize": "100%",
  "gridPos": {
    "h": 8,
    "w": 12,
    "x": 0,
    "y": 0
  },
  "id": 285,
  "pageSize": null,
  "showHeader": true,
  "sort": {
    "col": 0,
    "desc": true
  },
  "styles": [
    {
      "alias": "Time",
      "align": "auto",
      "dateFormat": "YYYY-MM-DD HH:mm:ss",
      "pattern": "Time",
      "type": "date"
    },
    {
      "alias": "",
      "align": "right",
      "colorMode": null,
      "colors": [
        "rgba(245, 54, 54, 0.9)",
        "rgba(237, 129, 40, 0.89)",
        "rgba(50, 172, 45, 0.97)"
      ],
      "decimals": 2,
      "mappingType": 1,
      "pattern": "Text",
      "thresholds": [],
      "type": "string",
      "unit": "short"
    },
    {
      "alias": "",
      "align": "auto",
      "colorMode": null,
      "colors": [
        "rgba(245, 54, 54, 0.9)",
        "rgba(237, 129, 40, 0.89)",
        "rgba(50, 172, 45, 0.97)"
      ],
      "dateFormat": "YYYY-MM-DD HH:mm:ss",
      "decimals": 2,
      "mappingType": 1,
      "pattern": "Title",
      "thresholds": [],
      "type": "string",
      "unit": "short"
    },
    {
      "alias": "",
      "align": "auto",
      "colorMode": null,
      "colors": [
        "rgba(245, 54, 54, 0.9)",
        "rgba(237, 129, 40, 0.89)",
        "rgba(50, 172, 45, 0.97)"
      ],
      "dateFormat": "YYYY-MM-DD HH:mm:ss",
      "decimals": 2,
      "mappingType": 1,
      "pattern": "Tags",
      "thresholds": [],
      "type": "string",
      "unit": "short"
    }
  ],
  "timeFrom": null,
  "timeShift": null,
  "title": "Panel Title",
  "transform": "annotations",
  "type": "table"
}
- Create a new Panel and format it as table. IMPORTANT
- copy new panel ID like 23763571993
- Edit old Panel JSON from Version 6.x and paste JSON as JSON for the new Panel (overwrite it):
- change old id to the new panel id
“id”: 285, to “id”: “id”: 23763571993, - Change old type table to new type table-old
“type”: “table” to “type”: “table-old” - APPLY this JSON
- Save dasboard
- Reload dashboard
This is the JSON for Grafana 7.x after applying the changes for id and type.
{
  "datasource": "-- Grafana --",
  "columns": [],
  "fontSize": "100%",
  "gridPos": {
    "h": 8,
    "w": 12,
    "x": 0,
    "y": 0
  },
  "id": 23763571993,
  "pageSize": null,
  "showHeader": true,
  "sort": {
    "col": 0,
    "desc": true
  },
  "styles": [
    {
      "alias": "Time",
      "align": "auto",
      "dateFormat": "YYYY-MM-DD HH:mm:ss",
      "pattern": "Time",
      "type": "date"
    },
    {
      "alias": "",
      "align": "right",
      "colorMode": null,
      "colors": [
        "rgba(245, 54, 54, 0.9)",
        "rgba(237, 129, 40, 0.89)",
        "rgba(50, 172, 45, 0.97)"
      ],
      "decimals": 2,
      "mappingType": 1,
      "pattern": "Text",
      "thresholds": [],
      "type": "string",
      "unit": "short"
    },
    {
      "alias": "",
      "align": "auto",
      "colorMode": null,
      "colors": [
        "rgba(245, 54, 54, 0.9)",
        "rgba(237, 129, 40, 0.89)",
        "rgba(50, 172, 45, 0.97)"
      ],
      "dateFormat": "YYYY-MM-DD HH:mm:ss",
      "decimals": 2,
      "mappingType": 1,
      "pattern": "Title",
      "thresholds": [],
      "type": "string",
      "unit": "short"
    },
    {
      "alias": "",
      "align": "auto",
      "colorMode": null,
      "colors": [
        "rgba(245, 54, 54, 0.9)",
        "rgba(237, 129, 40, 0.89)",
        "rgba(50, 172, 45, 0.97)"
      ],
      "dateFormat": "YYYY-MM-DD HH:mm:ss",
      "decimals": 2,
      "mappingType": 1,
      "pattern": "Tags",
      "thresholds": [],
      "type": "string",
      "unit": "short"
    }
  ],
  "timeFrom": null,
  "timeShift": null,
  "title": "Panel Title",
  "transform": "annotations",
  "type": "table-old"
}
The important lines are:
  "id": 23763571993,
  "transform": "annotations",
  "type": "table-old"
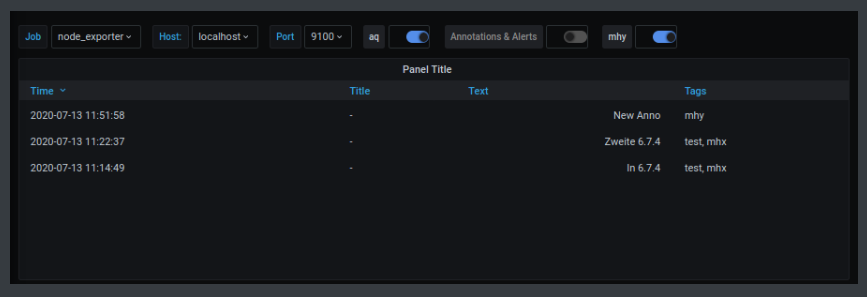
You have to define annotation queries like “aq” and “mhy” in the dashboard options to see you annotations in the table via the annotation tags you’ve given them during creation.

Resulting annotation table
Thanks!
I was able to get this to work for me too.
I hope this gets resolved in the next upgrade!
1 Like
not supported yet in the new panel. Working on, should be supported again in the next 5 months
3 Likes
Thanks @torkel! Will we be able to provide a specific annotation query (from those defined in the dashboard settings) in the new table?
My users are looking to using grafana annotations as a key communication vehicle between team members that may be on different shifts. So they would LOVE to be able to query all of the annotations and treat the result like a real data source. But it would be useful to be able to filter a table to just one (or potentially multiple?) annotation queries.
2 Likes
Hi Torkel,
Do you already have an idea when this (annotations in tabel panel) will be supported again?
Looking forward to it!
Greetings
3 Likes
+1, any update on when this might be available?
4 Likes