i’m using Grafana V8.1 on a raspberry pi with influxDB as a data source to monitor some photovoltaic module parameters. I have managed to visualize the I-V curve using the michaeldmoore scatter panel. I need to visualize another I-V curve collected with traditional multimeters on the same panel to compare the two curves in order to ensure the accuracy of my data collecting system. is that possible ?
Hi @mohamed12345,
Have you tried adding another query to the same panel?

Tested with:
Grafana: 9.3.6 OSS
InfluxDB: 2.6.1.
Plugin: Timeseries (preinstalled)
Best regards,
ldrascic
1 Like
In the another query, which data source i have to use?
can i enter data manually or use an excel file that contains the data collected by the multimeters ?
another question is :
is it possible to adjust the second graph to be sync with the graph plotted by the system ?
ich hoffe, das ich das Problem richtig verstanden habe.
Bei mir habe ich in einem Diagramm zwei Datenquellen. Eine zeigt den täglichen Verbrauch an Gas, den mir die Heizung liefert, die andere den täglichen tatsächlichen Gasverbrauch.
Über eine csv-Datei kann man Daten in Influx einlesen. Die Struktur lässt sich ermitteln, wenn man aus Influx Daten exportiert. Bitte melden, wenn weitere Informationen dazu gewünscht werden.

1 Like
Hi @mohamed12345,
If you have data from multimeters in csv you can import that into InfluxDB and use it as a datasource.
Import CSV
-
If you format your csv as annotated csv you can directly upload file via InfluxDB UI (
Load Data -> Buckets -> Add data -> CSV upload). In order to format annotated CSV take a look at annotated-csv. -
If you have only few rows you can put your data in query like mentioned at query-a-raw-csv-string (this is for classic CSV with no annotations).
-
Another option is to use CLI like mentioned at influx-write-command and inject-annotation-headers (if you want to specify annotation headers outside csv file). Using
dryrunin next command will only print data to standard output and it will note write data into influxdb. When you are sure that you want to write data use same command withoutdryrun.
influx write dryrun --bucket BucketName --org OrgName --precision ns --format=csv -f /path/to/file.csv
Note: for--precisionuses(seconds) if your data is recorded in seconds.
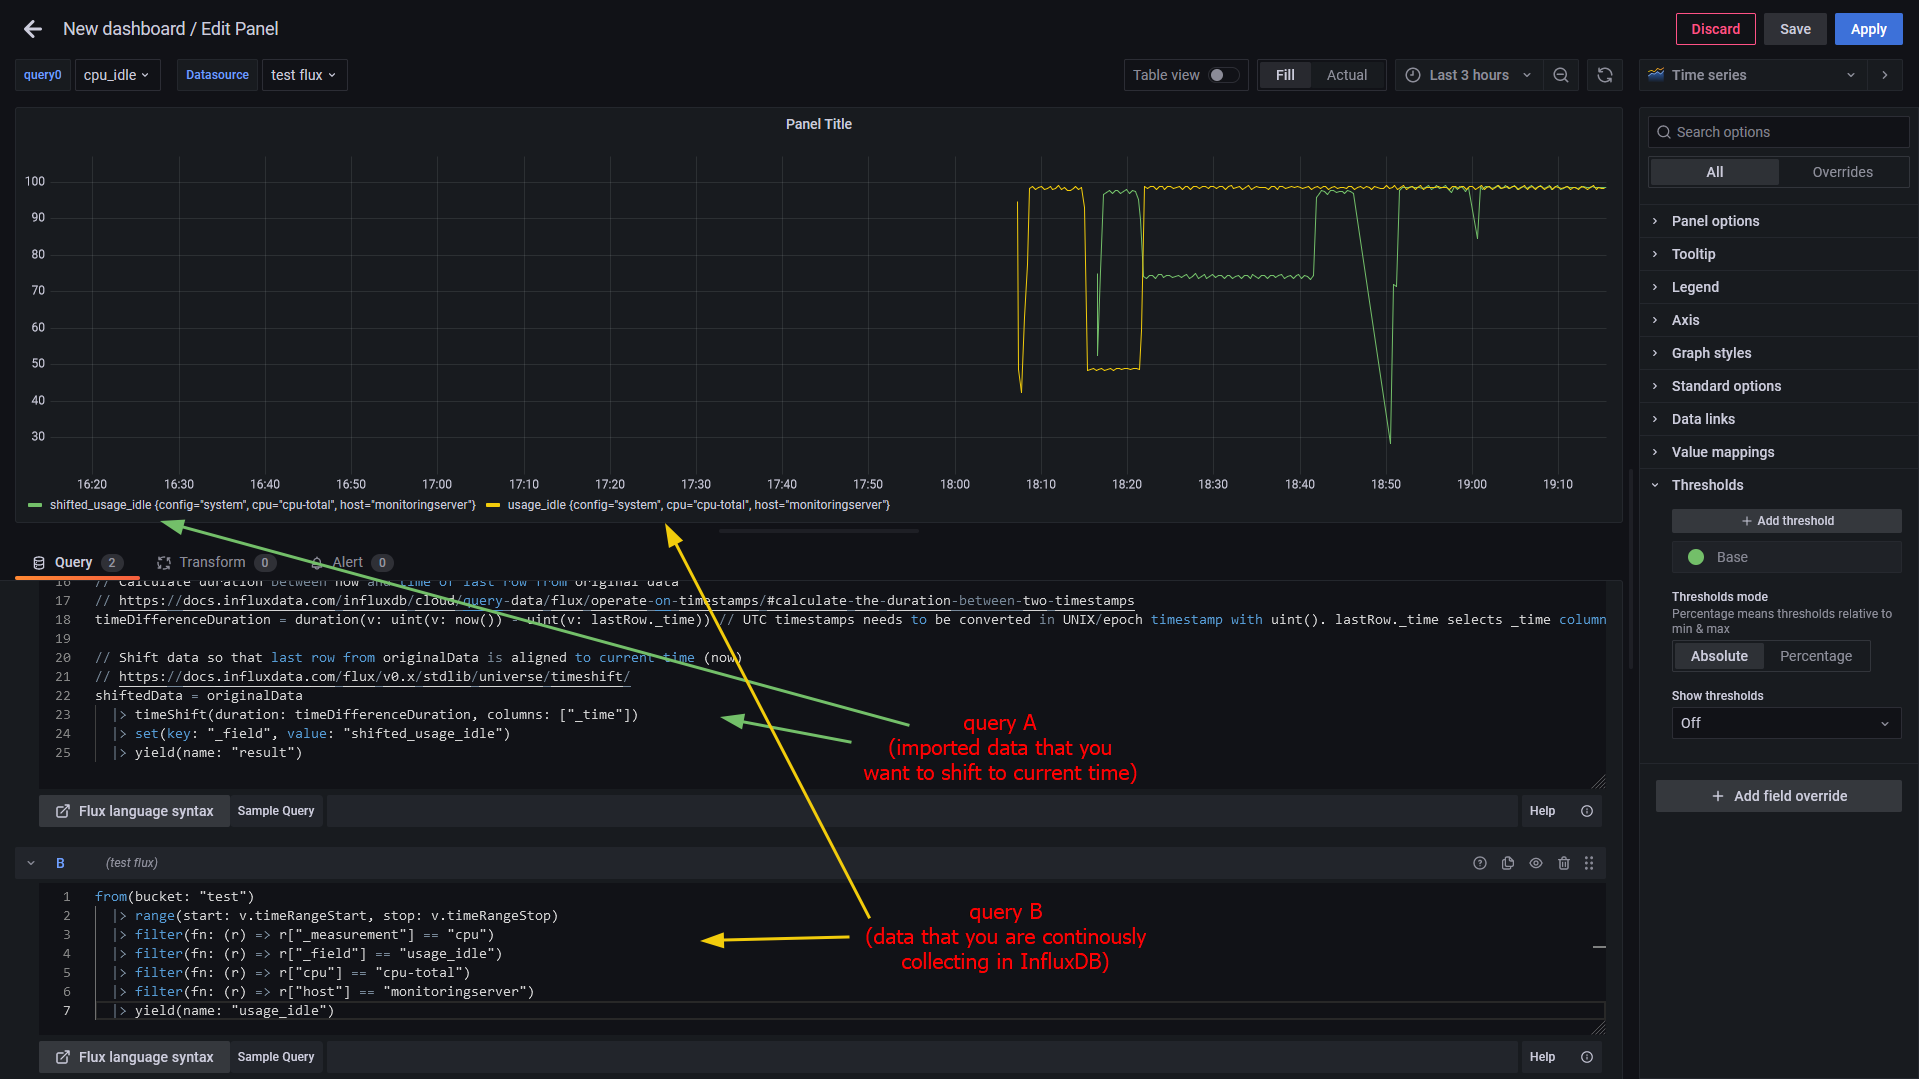
Shift imported data always to now()
Yes. Here is how you can do that.
Open for more info: Wrong approach with using aligntime function
At first I tought “Well I will just use aligntime function and set alignTo: now() and it will shift data to current time”. Here is an example query of that (wrong) approach:
import "experimental"

from(bucket: "test")
  |> range(start: 2023-02-19T18:15:00Z, stop: 2023-02-19T19:15:00Z) // Here use time range in which you find your original (imported) data
  |> filter(fn: (r) => r["_measurement"] == "cpu")
  |> filter(fn: (r) => r["_field"] == "usage_idle")
  |> filter(fn: (r) => r["cpu"] == "cpu-total")
  |> filter(fn: (r) => r["host"] == "monitoringserver")
  |> experimental.alignTime(alignTo: now())
  |> yield(name: "all_rows")
So, why is this approach wrong? This approach is wrong because it will shift data to now() but the most historical data point from selected range (i.e. data point with timestamp 2023-02-19T18:15:00Z) will be aligned to now() and all other data points will be shifted to future. Because of that you will never be able to compare data that you are continuously collection to InfluxDB and imported data from csv file. Here are pictures:
Wrong approach: Result in InfluxDB:

Wrong approach: Result in Grafana:

Notice that in Grafana I set time range
now-1h to now+1h in order to display data points that are shifted in future.
Correct approach with timeshift() function:
// Original (imported) data
originalData = from(bucket: "test")
  |> range(start: 2023-02-19T18:15:00Z, stop: 2023-02-19T19:15:00Z) // Here use time range in which you find your original (imported) data
  |> filter(fn: (r) => r["_measurement"] == "cpu")
  |> filter(fn: (r) => r["_field"] == "usage_idle")
  |> filter(fn: (r) => r["cpu"] == "cpu-total")
  |> filter(fn: (r) => r["host"] == "monitoringserver")
  |> yield(name: "all_rows")

// Select only last row from originalData
// https://docs.influxdata.com/influxdb/v2.6/query-data/flux/scalar-values/#extract-a-row
lastRow = originalData
  |> last()
  |> findRecord(fn: (key) => true, idx: 0) // Since we filtered data in originalData variable here we can use (key) => true. idx = 0 selects first (only) row

// Calculate duration between now and time of last row from original data
// https://docs.influxdata.com/influxdb/cloud/query-data/flux/operate-on-timestamps/#calculate-the-duration-between-two-timestamps
timeDifferenceDuration = duration(v: uint(v: now()) - uint(v: lastRow._time)) // UTC timestamps needs to be converted in UNIX/epoch timestamp with uint(). lastRow._time selects _time column from lastRow variable.

// Shift data so that last row from originalData is aligned to current time (now)
// https://docs.influxdata.com/flux/v0.x/stdlib/universe/timeshift/
shiftedData = originalData
  |> timeShift(duration: timeDifferenceDuration, columns: ["_time"])
  |> yield(name: "result")
Result in InfluxDB:

Last row of original data refers to the newest data point from imported data (i.e. 2023-02-19T19:15:00Z). Note that newest data point is now aligned to
now() (not the oldest like in wrong approach).
Result in Grafana:
Best regards,
ldrascic
2 Likes
very good.
many thanks
@grant2, @usman.ahmad, @yosiasz
Can you please rename this topic to “How to shift data to now without having data in future (align last data point to now)?” and maybe move it to InfluxDB category? That way other users might find this answer a bit easier.
Best regards,
ldrascic
1 Like
@usman.ahmad I do not have the abilities to change the thread title or assign a category. Can you do this?
Done and Thank you everyone for helping out !! ![]()
1 Like
Thank you so much for your solution here. I adapted it to use with my “Balkonkraftwerk” or small plug-in solar panel inverter. It may be useful for others using OpenDTU & iobroker.
Following was tested in ioBroker, can apply to various ranges, day over day, week over week, etc. Still testing it in Grafana.
currentData = from(bucket: “iobroker”)
|> range(start: v.timeRangeStart, stop: v.timeRangeStop)
|> filter(fn: (r) => r[“_measurement”] == “mqtt.0.solar.116191xxxxxx.0.power”)
|> filter(fn: (r) => r[“_field”] == “value”)
|> aggregateWindow(every: v.windowPeriod, fn: last, createEmpty: false)
|> yield(name: “currentData”)

// Select only first row from currentData
// reference cited in previous post: Extract scalar values in Flux | InfluxDB OSS v2 Documentation
rangeStart = currentData
|> first()
|> findRecord(fn: (key) => true, idx: 0)
// Since we filtered data in currentData variable, here we can use (key) => true. idx = 0 selects first (only) row

// repeat similar to previous
rangeEnd = currentData
  |> last()
  |> findRecord(fn: (key) => true, idx: 0)
// attempted to use v._timeRangeStart and v._timeRangeStop, but unsuccessful

// Calculate duration between start and end times of currentData
// reference cited in previous post: Operate on timestamps with Flux | InfluxDB Cloud (TSM) Documentation
timeDifferenceDuration = duration(v: uint(v: rangeEnd._time) - uint(v: rangeStart._time))

// calculate the start time of comparison data, one time period earlier
shiftedStart = time(v: uint(v: rangeStart._time) - uint(v: timeDifferenceDuration))

// calculate the window period to aggregate data and reduce results for Grafana
shiftedEvery = uint(v: timeDifferenceDuration) / uint(v: 8000)

// get shifted data from earlier in the same data source, and apply the shift duration defined by the data range
shiftedData = from(bucket: “iobroker”)
  |> range(start: shiftedStart, stop: rangeStart._time)
  |> filter(fn: (r) => r[“_measurement”] == “mqtt.0.solar.116191xxxxxx.0.power”)
  |> filter(fn: (r) => r[“_field”] == “value”)
  |> aggregateWindow(every: duration(v: shiftedEvery), fn: mean, createEmpty: false)
  |> timeShift(duration: timeDifferenceDuration, columns: [“_time”])
  |> yield(name: “shiftedData”)