How to send traces from Node.js OTEL SDK to Tempo?

I currently have this code:

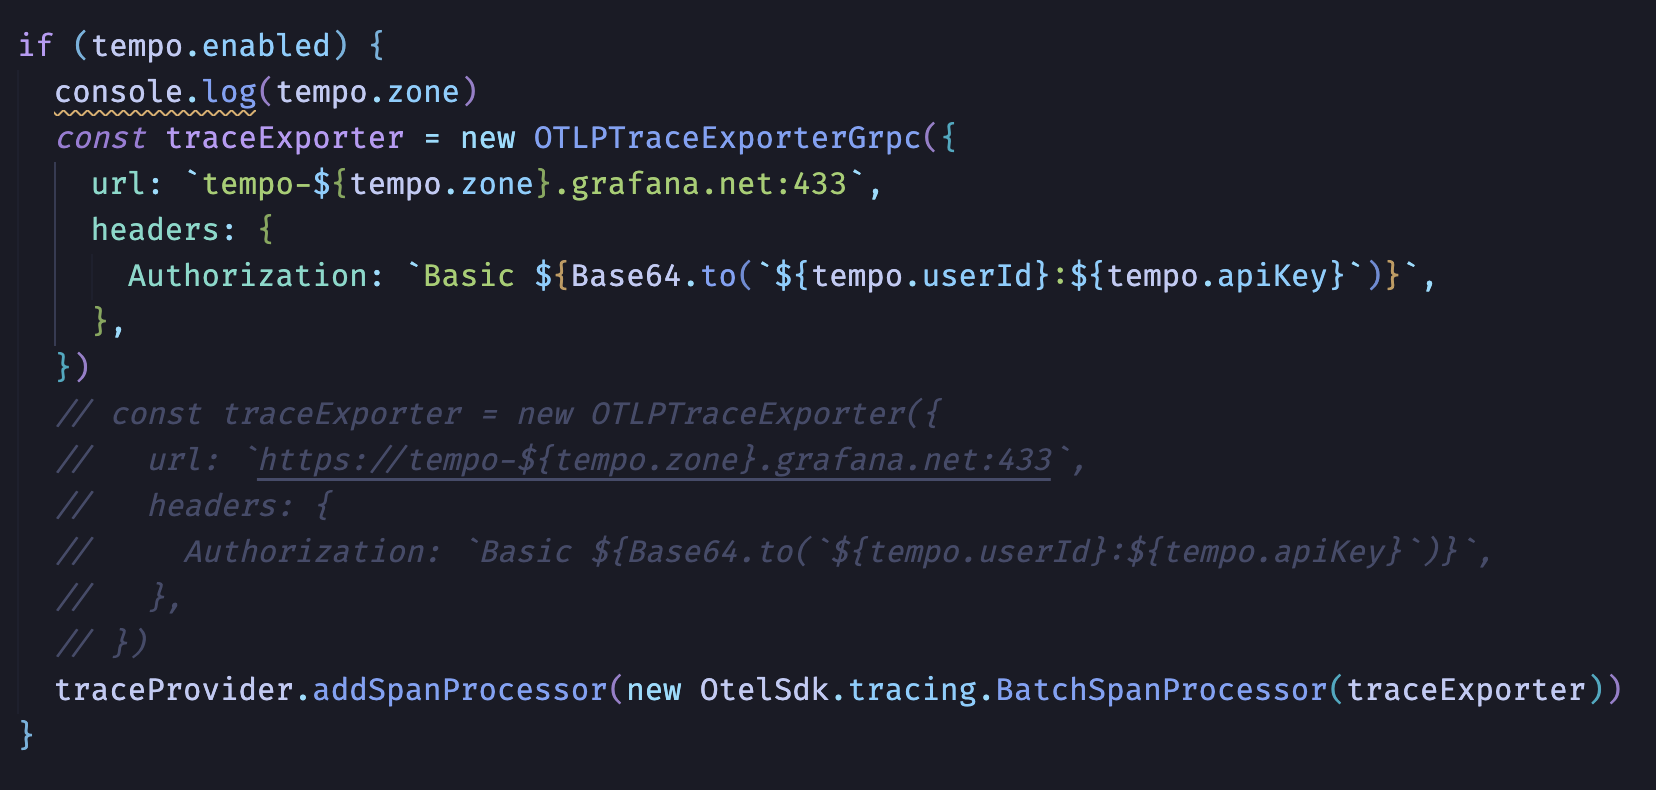
  if (tempo.enabled) {
    const traceExporter = new OTLPTraceExporterGrpc({
      url: `https://tempo-${tempo.zone}.grafana.net/tempo`,
      headers: {
        Authorization: `Basic ${Base64.to(`${tempo.userId}:${tempo.apiKey}`)}`,
      },
    })
    traceProvider.addSpanProcessor(new OtelSdk.tracing.BatchSpanProcessor(traceExporter))
  }

But it fails at runtime like so:

{"stack":"Error: 13 INTERNAL: Received RST_STREAM with code 0\n    at callErrorFromStatus (/Users/jasonkuhrt/projects/prisma/pdp-control-plane/node_modules/.pnpm/@grpc+grpc-js@1.8.4/node_modules/@grpc/grpc-js/src/call.ts:81:17)\n    at Object.onReceiveStatus (/Users/jasonkuhrt/projects/prisma/pdp-control-plane/node_modules/.pnpm/@grpc+grpc-js@1.8.4/node_modules/@grpc/grpc-js/src/client.ts:356:55)\n    at Object.onReceiveStatus (/Users/jasonkuhrt/projects/prisma/pdp-control-plane/node_modules/.pnpm/@grpc+grpc-js@1.8.4/node_modules/@grpc/grpc-js/src/client-interceptors.ts:455:34)\n    at Object.onReceiveStatus (/Users/jasonkuhrt/projects/prisma/pdp-control-plane/node_modules/.pnpm/@grpc+grpc-js@1.8.4/node_modules/@grpc/grpc-js/src/client-interceptors.ts:417:48)\n    at /Users/jasonkuhrt/projects/prisma/pdp-control-plane/node_modules/.pnpm/@grpc+grpc-js@1.8.4/node_modules/@grpc/grpc-js/src/resolving-call.ts:110:24\n    at processTicksAndRejections (node:internal/process/task_queues:78:11)\nfor call at\n    at ServiceClientImpl.makeUnaryRequest (/Users/jasonkuhrt/projects/prisma/pdp-control-plane/node_modules/.pnpm/@grpc+grpc-js@1.8.4/node_modules/@grpc/grpc-js/src/client.ts:326:30)\n    at ServiceClientImpl.<anonymous> (/Users/jasonkuhrt/projects/prisma/pdp-control-plane/node_modules/.pnpm/@grpc+grpc-js@1.8.4/node_modules/@grpc/grpc-js/src/make-client.ts:189:15)\n    at OTLPTraceExporter.send [as _send] (/Users/jasonkuhrt/projects/prisma/pdp-control-plane/node_modules/.pnpm/@opentelemetry+otlp-grpc-exporter-base@0.35.0_@opentelemetry+api@1.4.0/node_modules/@opentelemetry/otlp-grpc-exporter-base/src/util.ts:105:35)\n    at /Users/jasonkuhrt/projects/prisma/pdp-control-plane/node_modules/.pnpm/@opentelemetry+otlp-grpc-exporter-base@0.35.0_@opentelemetry+api@1.4.0/node_modules/@opentelemetry/otlp-grpc-exporter-base/src/OTLPGRPCExporterNodeBase.ts:70:12\n    at new Promise (<anonymous>)\n    at OTLPTraceExporter._sendPromise (/Users/jasonkuhrt/projects/prisma/pdp-control-plane/node_modules/.pnpm/@opentelemetry+otlp-grpc-exporter-base@0.35.0_@opentelemetry+api@1.4.0/node_modules/@opentelemetry/otlp-grpc-exporter-base/src/OTLPGRPCExporterNodeBase.ts:69:21)\n    at Immediate.<anonymous> (/Users/jasonkuhrt/projects/prisma/pdp-control-plane/node_modules/.pnpm/@opentelemetry+otlp-grpc-exporter-base@0.35.0_@opentelemetry+api@1.4.0/node_modules/@opentelemetry/otlp-grpc-exporter-base/src/OTLPGRPCExporterNodeBase.ts:108:14)\n    at processImmediate (node:internal/timers:466:21)\n    at process.topLevelDomainCallback (node:domain:161:15)\n    at process.callbackTrampoline (node:internal/async_hooks:128:24)","message":"13 INTERNAL: Received RST_STREAM with code 0","code":"13","details":"Received RST_STREAM with code 0","metadata":"[object Object]","progress":"PROCESSED","name":"Error"}

Any help appreciated. Somehow the Grafana docs fail to cover this topic (of sending traces directly from an application, assuming all users want to setup an agent).

Don’t use a /tempo endpoint in your url. That’s for datasource (http connection), not for grpc connection, which you need in this case.

I’ve tried removing it, didn’t help. I’ve tried using the non-grpc trace exporter didn’t help. I am currently trying this: nodejs-opentelemetry-tempo/tracing.js at main · mnadeem/nodejs-opentelemetry-tempo · GitHub (JaegerExporter).

Example, this code:

Leads to this error:

Error: 13 INTERNAL: Received RST_STREAM with code 0

Use GRPC, not HTTP exporter. Use “URL” format from the doc:


I guess some exporters don’t implement “https” correctly.

Print all variables to log and verify that they are OK. API key must have MetricsPublisher role.

Credentials are proven good because I was able to send traces through the collector. The issue is when trying to send directly from the app. Zone is good too: eu-west-0.

This updated code (no https):

Leads to:

Error: 4 DEADLINE_EXCEEDED: Deadline exceeded

It seems like removing the https just further breaks it if anything.

Basic question: do you have an network connectivity to that host:443?

Yes via the debug mode of OTEL I see this before the error:

[dev:app  ] items to be sent [
[dev:app  ]   Span {
[dev:app  ]     attributes: {
[dev:app  ]       'git.branch': '__unknown__',
[dev:app  ]       'git.sha': '__unknown__',
[dev:app  ]       'git.author': '__unknown__'
[dev:app  ]     },
[dev:app  ]     links: [],
[dev:app  ]     events: [],
[dev:app  ]     status: { code: 0 },
[dev:app  ]     endTime: [ 1675887874, 350134458 ],
[dev:app  ]     _ended: true,
[dev:app  ]     _duration: [ 0, 58134458 ],
[dev:app  ]     name: 'boot',
[dev:app  ]     _spanContext: {
[dev:app  ]       traceId: '03011e5ccf2bac54889cb489dbea2d38',
[dev:app  ]       spanId: 'cb1016fde633e982',
[dev:app  ]       traceFlags: 1,
[dev:app  ]       traceState: undefined
[dev:app  ]     },
[dev:app  ]     parentSpanId: undefined,
[dev:app  ]     kind: 0,
[dev:app  ]     _performanceStartTime: 3104.7016249895096,
[dev:app  ]     _performanceOffset: -0.356689453125,
[dev:app  ]     _startTimeProvided: false,
[dev:app  ]     startTime: [ 1675887874, 292000000 ],
[dev:app  ]     resource: Resource { attributes: [Object] },
[dev:app  ]     instrumentationLibrary: { name: 'mammoth', version: undefined, schemaUrl: undefined },
[dev:app  ]     _spanLimits: {
[dev:app  ]       attributeValueLengthLimit: Infinity,
[dev:app  ]       attributeCountLimit: 128,
[dev:app  ]       linkCountLimit: 128,
[dev:app  ]       eventCountLimit: 128
[dev:app  ]     },
[dev:app  ]     _spanProcessor: MultiSpanProcessor { _spanProcessors: [Array] },
[dev:app  ]     _attributeValueLengthLimit: Infinity
[dev:app  ]   }
[dev:app  ] ]
[dev:app  ] Service request {
[dev:app  ]   resourceSpans: [ { resource: [Object], scopeSpans: [Array], schemaUrl: undefined } ]
[dev:app  ] }


Port is wrong. Please use text instead of images.

1 Like

Ah thanks, back to previous error now:

const traceExporter = new OTLPTraceExporterGrpc({
      url: `tempo-${tempo.zone}.grafana.net:443`,
      headers: {
        Authorization: `Basic ${Base64.to(`${tempo.userId}:${tempo.apiKey}`)}`,
      },
    })
Error: 13 INTERNAL: Received RST_STREAM with code 0

try to prop the url and auth as variables to vet those values out.

let url = `tempo-${tempo.zone}.grafana.net:443`
let auth = `Basic ${Base64.to(`${tempo.userId}:${tempo.apiKey}`)}`

console.log('Work!', url, auth)

const traceExporter = new OTLPTraceExporterGrpc({
      url: url,
      headers: {
        Authorization: auth,
      },
    })

and see if the values therein are good and expected. Is this a GET or POST?
Can you try to vet this using insomnia or POSTMAN like tools if possible?

1 Like

It is a gRPC protocol (not a plain HTTP protocol), so it is more complicated. Yes, Postman and Insomnia can make gRPC request, but it is not so easy as HTTP request.

1 Like

The values are correct.

I have no idea what HTTP method is being used but that should be handled by the respective spec compliant libraries. As well, this is gRPC, not the vanilla HTTP exporter. Does method even matter? etc.

Hi, I’ve not used this library, but looking at the examples in the repo it mentions plaintext is used by default and TLS must be enabled. Can you try the same? This section and the line is:

credentials: grpc.credentials.createSsl(),

2 Likes

In the repo example I do not see auth being sent in the headers

Yep I tried that but still doesn’t work:

const traceExporter = new OTLPTraceExporterGrpc({
      url: `tempo-${tempo.zone}.grafana.net:443`,
      credentials: Grpc.credentials.createSsl(),
      headers: {
        Authorization: `Basic ${Base64.to(`${tempo.userId}:${tempo.apiKey}`)}`,
      },
    })
Error: 13 INTERNAL: Received RST_STREAM with code 0

Hi kuhrt,

were you able to solve your issue and does it work for you? Trying to setup the exact same thing and it does not work so far.

Hello all,

as I had the same issue: Probably you created your API key at https://<YOUR_ORG>.grafana.net/org/apikeys. Instead, create the API key at https://grafana.com/orgs/<YOUR_ORG>/api-keys. There, you can also select the MetricsPublisher role as stated in the documentation.

Just use the complete URL, even with grpc, meaning: https://tempo-<ZONE>.grafana.net/tempo

Hope, this helps you.

I guess you can’t send headers with http. I had the same issue and solve with gRPC.

import { OTLPTraceExporter } from '@opentelemetry/exporter-trace-otlp-grpc';
import * as grpc from '@grpc/grpc-js';

process.env.OTEL_EXPORTER_OTLP_HEADERS = `Authorization=Basic ${Buffer.from(`<YOUR_USER_ID>:<YOUR_PASSWORD>`).toString('base64')}`

const traceExporter = new OTLPTraceExporter({
  url: 'https://tempo-<YOUR_ZONE>.grafana.net:443',
  credentials: grpc.credentials.createSsl(),
});