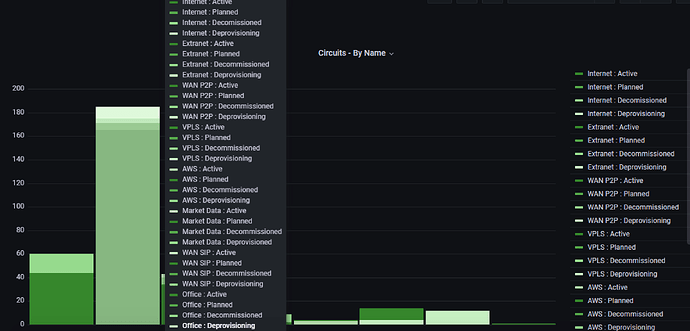
Hey! I’m pretty new to Grafana and Prometheus as a whole, but I was just having trouble with the bar chart feature (which I understand is still beta) and I haven’t seen a whole lot of documentation online about it. I’ve created a stacked bar chart tracking circuit types and I was having some issues with the legend.
-
What are you trying to achieve?
I would like to organize the legend by the export job. For example, when you hover over the stacked bar chart, the legend should simply display the 4 metrics of the exported job. -
How are you trying to achieve it?
I am using the outer join transformation in order to organize the bar chart. The outer join command simply organizes the bar chart by the exported job. From my understanding, this is the main way to create a stacked bar chart from a series of instances. -
What happened?
I get this huge legend… It is the exact same for any of the barchart segments.
-
What did you expect to happen?
I expected -when hovering over a segment of the barchart- for the legend to display the 4 components of the exported job. In this case, I would like internet circuits to show: active, planned, decom and deprov.
