Hi there,
I’m new with Grafana and working through the documentation, so please bear with me if this is obvious ![]()
I’m trying to setup a single panel to show a metric from multiple datasources.
Disk usage of multiple servers running Plesk (webhosting admin software)
Each Plesk server provides a datasource that’s based on the json-backend-datasource module.
So I created a panel containing a “Mixed” datasource, containing a query for each server, that use the specific datasource for that server.
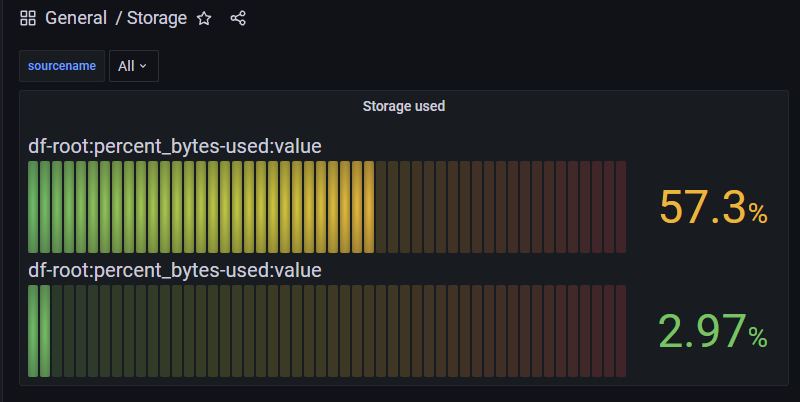
That works fine, but due to the fact that the metric is called the same in each datasource, I cannot distinguish the bar gauges. See below.
Is there any way to change the bar gauge label to the query name or anything else that is specific to the query or datasource used?
I tried the DisplayName panel option, but that changes the label of all gauges.
I looked at the “Rename by regex” transformation, which allows me to change the label, but again it affects all gaube labels and I don’t see how to add the query name in there.
Looking at the json responses from the datasources, I found the “refId” in there, which is the query name. But I could find a way to use that as a lable of the bar gauge.
Any ideas or hints where to start reading?
Thanks a lot,
Christian