-
What Grafana version and what operating system are you using?
-
Grafana v8.0.5 (cbb2aa5001)
-
Linux Mint 20.1 Cinnamon
-
InfluxDB v1.9
-
What are you trying to achieve?
Display 4 x standard circular gauges in a panel which uses 4 queries (there are 4 batteries), each gauge labelled underneath with the Alias of its respective query (e.g. “Battery 1”). -
How are you trying to achieve it?
By adding the text to the ALIAS field of the query template. (That method works OK for the BarGraph component). -
What happened?
The Query Aliases were not used as labels for the Gauge instances (see image below):
-
What did you expect to happen?
Consistent with other panel controls (e.g. the BarGraph), I expected that the query alias would be used as a label for each gauge instance in the panel. -
Can you copy/paste the configuration(s) that you are having problems with?
See JSON segment at the foot of this post.

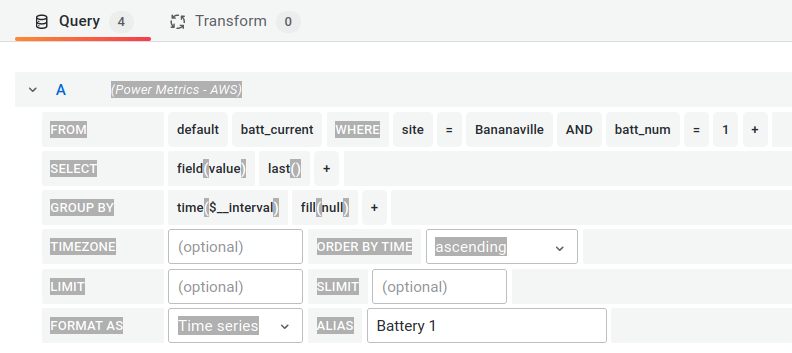
Here is an example of one of the queries.
Using the Query Inspector I see the following, but I note that no aliases are visible in the inspector’s query text:
SELECT last(“value”) FROM “batt_current” WHERE (“site” = ‘Bananaville’
AND “batt_num” = ‘1’) AND time >= now() - 24h and time <= now()
GROUP BY time(1m) fill(null);SELECT last(“value”) FROM “batt_current” WHERE (“site” = ‘Bananaville’
AND “batt_num” = ‘2’) AND time >= now() - 24h and time <= now()
GROUP BY time(1m) fill(null);SELECT last(“value”) FROM “batt_current” WHERE (“site” = ‘Bananaville’
AND “batt_num” = ‘3’) AND time >= now() - 24h and time <= now()
GROUP BY time(1m) fill(null);SELECT last(“value”) FROM “batt_current” WHERE (“site” = ‘Bananaville’
AND “batt_num” = ‘4’) AND time >= now() - 24h and time <= now()
GROUP BY time(1m) fill(null)
-
Did you receive any errors in the Grafana UI or in related logs? If so, please tell us exactly what they were.
No - the gauge works OK except that none of the gauge instances has a label to uniquely identify them (each query relating to a particular gauge instance does have a unique Alias defined, which we intended to be used as a label). -
Did you follow any online instructions? If so, what is the URL?
No.
Here is the panel JSON text. I note that the Alias definition does appear in the JSON text.
{
“id”: 36,
“gridPos”: {
“h”: 6,
“w”: 14,
“x”: 10,
“y”: 0
},
“type”: “gauge”,
“title”: “Battery Currents (-ve = Charging)”,
“datasource”: “Power Metrics - AWS”,
“pluginVersion”: “8.0.5”,
“fieldConfig”: {
“defaults”: {
“thresholds”: {
“mode”: “absolute”,
“steps”: [
{
“color”: “transparent”,
“value”: null
},
{
“color”: “green”,
“value”: -250
},
{
“color”: “yellow”,
“value”: 0
},
{
“color”: “super-light-orange”,
“value”: 250
}
]
},
“mappings”: ,
“color”: {
“mode”: “thresholds”
},
“decimals”: 1,
“max”: 50,
“min”: -50,
“noValue”: “N/A”,
“unit”: “amp”
},
“overrides”:
},
“options”: {
“reduceOptions”: {
“values”: false,
“calcs”: [
“lastNotNull”
],
“fields”: “”
},
“showThresholdLabels”: true,
“showThresholdMarkers”: true,
“text”: {
“titleSize”: 1
}
},
“targets”: [
{
“alias”: “Battery 1”,
“groupBy”: [
{
“params”: [
“$__interval”
],
“type”: “time”
},
{
“params”: [
“null”
],
“type”: “fill”
}
],
“measurement”: “batt_current”,
“orderByTime”: “ASC”,
“policy”: “default”,
“refId”: “A”,
“resultFormat”: “time_series”,
“select”: [
[
{
“params”: [
“value”
],
“type”: “field”
},
{
“params”: ,
“type”: “last”
}
]
],
“tags”: [
{
“key”: “site”,
“operator”: “=”,
“value”: “Bananaville”
},
{
“condition”: “AND”,
“key”: “batt_num”,
“operator”: “=”,
“value”: “1”
}
]
},
{
“alias”: “Battery 2”,
“groupBy”: [
{
“params”: [
“$__interval”
],
“type”: “time”
},
{
“params”: [
“null”
],
“type”: “fill”
}
],
“hide”: false,
“measurement”: “batt_current”,
“orderByTime”: “ASC”,
“policy”: “default”,
“refId”: “B”,
“resultFormat”: “time_series”,
“select”: [
[
{
“params”: [
“value”
],
“type”: “field”
},
{
“params”: ,
“type”: “last”
}
]
],
“tags”: [
{
“key”: “site”,
“operator”: “=”,
“value”: “Bananaville”
},
{
“condition”: “AND”,
“key”: “batt_num”,
“operator”: “=”,
“value”: “2”
}
]
},
{
“alias”: “Battery 3”,
“groupBy”: [
{
“params”: [
“$__interval”
],
“type”: “time”
},
{
“params”: [
“null”
],
“type”: “fill”
}
],
“hide”: false,
“measurement”: “batt_current”,
“orderByTime”: “ASC”,
“policy”: “default”,
“refId”: “C”,
“resultFormat”: “time_series”,
“select”: [
[
{
“params”: [
“value”
],
“type”: “field”
},
{
“params”: ,
“type”: “last”
}
]
],
“tags”: [
{
“key”: “site”,
“operator”: “=”,
“value”: “Bananaville”
},
{
“condition”: “AND”,
“key”: “batt_num”,
“operator”: “=”,
“value”: “3”
}
]
},
{
“alias”: “Battery 4”,
“groupBy”: [
{
“params”: [
“$__interval”
],
“type”: “time”
},
{
“params”: [
“null”
],
“type”: “fill”
}
],
“hide”: false,
“measurement”: “batt_current”,
“orderByTime”: “ASC”,
“policy”: “default”,
“refId”: “D”,
“resultFormat”: “time_series”,
“select”: [
[
{
“params”: [
“value”
],
“type”: “field”
},
{
“params”: ,
“type”: “last”
}
]
],
“tags”: [
{
“key”: “site”,
“operator”: “=”,
“value”: “Bananaville”
},
{
“condition”: “AND”,
“key”: “batt_num”,
“operator”: “=”,
“value”: “4”
}
]
}
]
}
What have I missed or done wrong in the panel configuration?
Eric


