i’m still new in Grafana, am monitoring some couples of PC with different capacity of Hard-disc und Partions. Grafana, it combines the different numbers Hard –Disc und its partions together in one Graph and gives out all in one.
Could you please help me to provide me queries to be used in a single graph which can enable to show the different partions from a Hard –disc as well.? Thanks
Can you provide more details, please.
- What data source are you using?
- What does your query look like? Can you paste a screenshot of the query.
Hi Daniellee, many thanks… here are my queries:
I think what you are asking for is the groupByNode function. See an example here.
Do you mean you want to combine these 3 queries into one query as well? You can do that with globbing:
http://play.grafana.org/dashboard/db/ultimate-graphite-query-guide?orgId=1
Hi,
- am using this Verison:

- am still looking forward for the help. so far i came to this point:
- my plotation on graph is from this:

Grafana, it combines the different numbers Hard –Disc und its partions together in one Graph and gives out all in one.
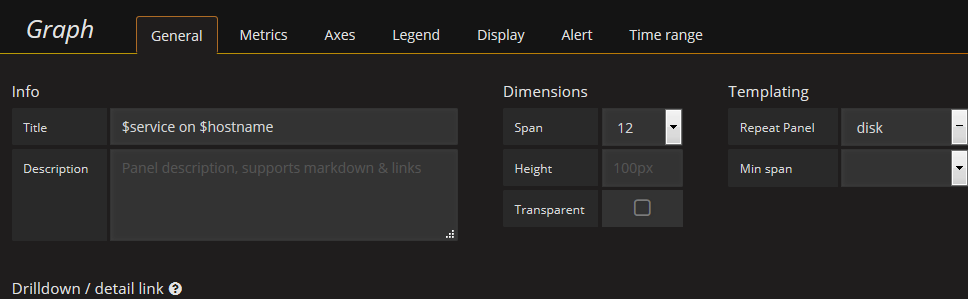
- MY TEMPLATING:
- General
-
Metrics Querry:

Could you please help me to provide me queries to be used in order to duplicate the number graphs which can enable to show the different partions from a Hard –disc simultaneously (different Graph simultaneously)
many thanks
Did you try the GroupByNode function? I see that you did not click on the example link for it. As I said before, I think that is what you want to do. (If you cannot use GroupByNode, you can also have one query per hard disk/partition but that might be a lot of queries?)
There is an Icinga dashboard on Grafana.com that might help you get started:
Hi,
i think this should be my problem…
1.) where should i add the Function " GroupByNode" from?
2.)one query per hard disk/partition : This it won’t work as our the Monitoring works to a different kind of server ( whose capacity are not identical i.e hard Disk are different to another as well as Partions)
Many thanks
I don’t really know what your data looks like but it looks like you have a timeserie:
icinga2.*.services.*.*.perfdata.*.value
It would seem that the first wildcard (*) is the hostname, the second is the service. The third and fourth wildcards I’m not sure what they are but one of them is probably what you are looking for.
So just guessing but maybe this:
groupByNode(icinga2.$hostname.services.$service.*.perfdata.*.value, 4, 'sum')
or this:
groupByNode(icinga2.$hostname.services.$service.*.perfdata.*.value, 6, 'sum')