Problem statement :
My bar chart is based on Postgres SQL:
select the_date, name, max(value) as max_value
from T
where the_date >= DATE(‘2023-08-01T07:00:00Z’) and the_date <= DATE(‘2023-09-01T06:59:59Z’)
group by the_date, name
order by the_date, name
In Bar chart properties I specified X Axis as “the_date”
In Postgres table the “the_date” column has type “DATE”.
Problem #1: currently the bar chart shows the x-axis labels as several identical values
17:00:00.000 17:00:00.000 17:00:00.000 17:00:00.000 17:00:00.000
But I want to show on X-axis the dates in format MM-DD, for example
08-01 08-02 08-03
Problem #2:
All bars for the same date should be under the single X-axis label.
But currently every bar has his own X-axis label.
Suggestion: You can use business charts

Step 1: Create table and insert data in it.

Step 2: Select business charts visualizations to display data on panel.

Step 3 : Use this query to fetch the data

Step 4 : Write function code mention below

return {
dataset: {
source: [
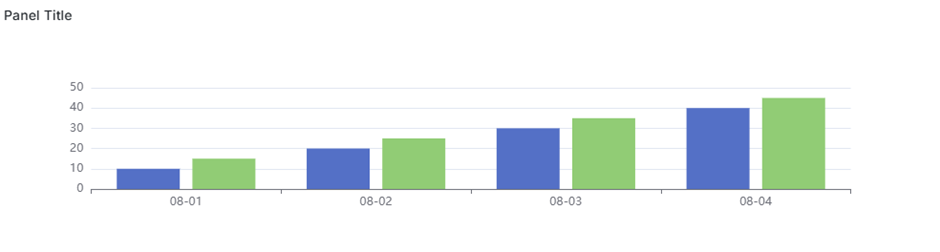
[‘Date’, ‘A’, ‘B’],
[‘08-01’, 10, 15],
[‘08-02’, 20, 25],
[‘08-03’, 30, 35],
[‘08-04’, 40, 45]
],
},
series: [
{
name: ‘A’,
type: ‘bar’,
data: [10, 20, 30, 40],
},
{
name: ‘B’,
type: ‘bar’,
data: [15, 25, 35, 45],
}
],
xAxis: {
type: ‘category’,
data: [‘08-01’, ‘08-02’, ‘08-03’, ‘08-04’],
},
yAxis: {
type: ‘value’,
},
};
Final output: