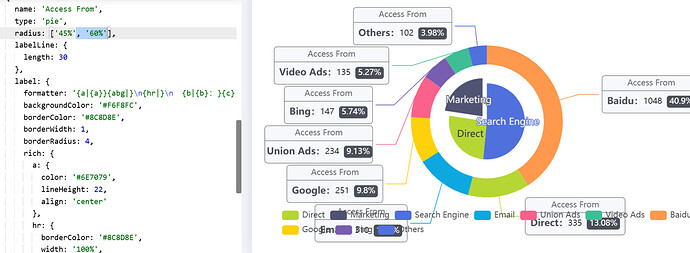
How to display total count inside donut type pie chart.
3 Likes
did you get this figured out? Trying to solve the same issue.
1 Like
Hi,
Do you resolve this issue?? I am also finding away to do this?
1 Like
It’s not a feature - help upvote in GitHub Ability to put value inside Donut (Pie) chart · Issue #93699 · grafana/grafana
Hello @sathyals ,
After analyzing the issue, I believe I have identified the underlying problem. Please find below the recommended steps that may help resolve it
Step 1. Create table and Insert dummy data
CREATE TABLE build_status (
    id SERIAL PRIMARY KEY,
    status VARCHAR(10) -- 'SUCCESS' or 'FAILURE'
);

-- Insert dummy data
INSERT INTO build_status (status) VALUES
('SUCCESS'), ('SUCCESS'), ('FAILURE'), ('SUCCESS'), ('FAILURE'),
('SUCCESS'), ('SUCCESS'), ('FAILURE'), ('SUCCESS'), ('SUCCESS');
Step 2. Integrate PostgreSQL with Grafana
Ensure that your PostgreSQL database is added as a data source in Grafana.
Step 3. Write a panel query
SELECT
  status,
  COUNT(*) AS total,
  ROUND((COUNT(*) * 100.0) / (SELECT COUNT(*) FROM build_status), 2) AS percentage
FROM build_status
GROUP BY status;
Step 4. Configure the panel settings
Final Output :-
@infofcc3 I think he’s after the grand total so 7+3 = 10
1 Like


