Grafana v11.2.0 (c57667e448), Raspberry Pi OS
Hello,
Grafana newbie here so bear with me. I have been poring over documentation and tutorials for hours but cannot seem to figure this out. I’m looking to build a dashboard that can display a simple Online/Offline status for various servers on the network.
I’m currently trying to do this with the Stat visualization using Prometheus on the monitored systems as a data source. I can successfully get this to work with various dashboard templates displaying various information from the remote server. In particular, the Full Server Status (18639) dashboard has the exact Stat panel I’d like to use. It shows a status of ONLINE unless the source has not been responsive for several minutes, at which point it changes to OFFLINE
I have tried creating a library panel from this ONLINE/OFFLINE panel within the Full Server Status dashboard, then importing it to a new dashboard. I have also tried creating a new Stat panel and manually configuring it with all of the exact same options and the same data source. However it always shows a status of OFFLINE regardless of whether the server is up, while the same panel in the Full Server Status dashboard shows a status of ONLINE.
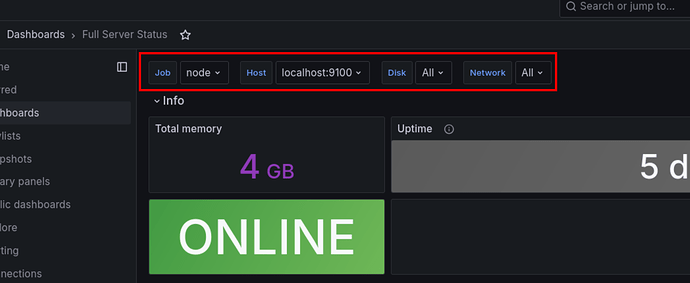
I would have expected the identical panel to show the same status in both dashboards, so I do not know what I am missing. The only difference I see is that the Full Server Status dashboard shows the following configurations at the top, whereas my custom dashboard does not.
I’m not sure what I’m missing here. I am a bit confused as to why the Host says localhost:9100 instead of the IP of the remote server, which I can confirm the displayed data is from. Any ideas or anything obvious I’m missing?
Full Server Status Dashboard: Full Server Status | Grafana Labs

