Dear Grafana Community,
I am new to Grafana and have a hard time displaying my sensor data the way i want. I guess i just miss something. Any help is appreciated!
What Grafana version and what operating system are you using?
Grafana Cloud (free plan)
What are you trying to achieve?
Want to display sensor data recorded at a fixed sampling rate (thus known record interval) and known starting date/time of the data acquisition. Data is saved into a .csv file without timestamp data. To keep file size as low as possible i have chosen not to include timestamp data into the csv file. In case one knows the sampling rate and the start/end time of the recording, there is no need to timestamp each individual value.
How are you trying to achieve it?
I import .csv files using the CSV plugin into Grafana.
What happened?
I can access my data inside the CSV files but grafana can display my data only in table format as my csv files do not contain any timestamps.
What did you expect to happen?
I expected i can display my csv data also as time series as my files contain sensor values recorded at a fixed sampling rate, by which my data is timeseries data by definition.
Can you copy/paste the configuration(s) that you are having problems with?
My problem is that i can not find any way to tell grafana what was the time interval between each data record (aka sampling rate) and when the first value has been recorded. I think this should be really easy to do, i guess i just miss how to do it.
I understand i could import my csv into a time based DB first and use that as a source for grafana, however sensor data does not change over time and thus i do not see the point why should i use a larger stack than what would be absolutely needed.
I am trying to display the value of a single metric (system voltage of an embedded MCU) over time as a line chart. Exactly that is how grafana time series panel would display timeseries data. I just can not find a way to tell grafana what was the sampling interval and start/end time.
@yosiasz , @mikhailvolkov
Thank you very much, will check that out.
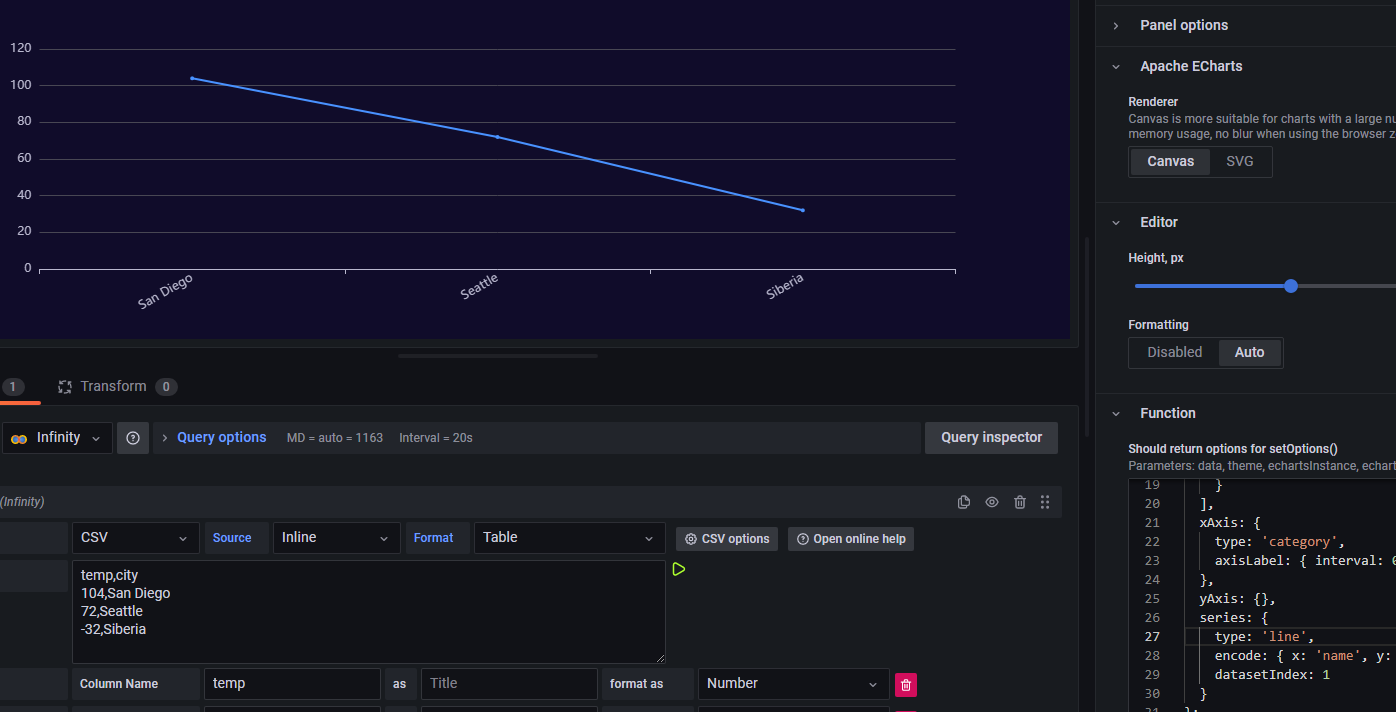
Though i was considering to switch to grafana from highcharts/highstocks ECharts seems to be very similar to these for the first sight
so this is not a separate product. it is grafana itself using apache echart as a plugin.
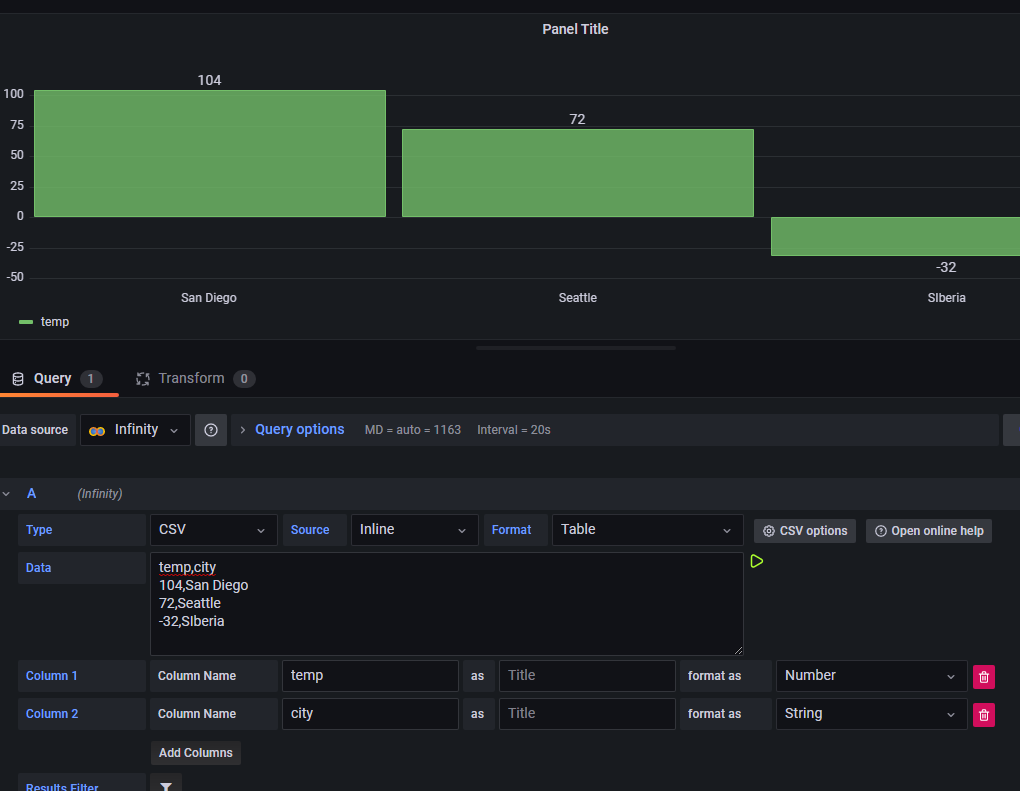
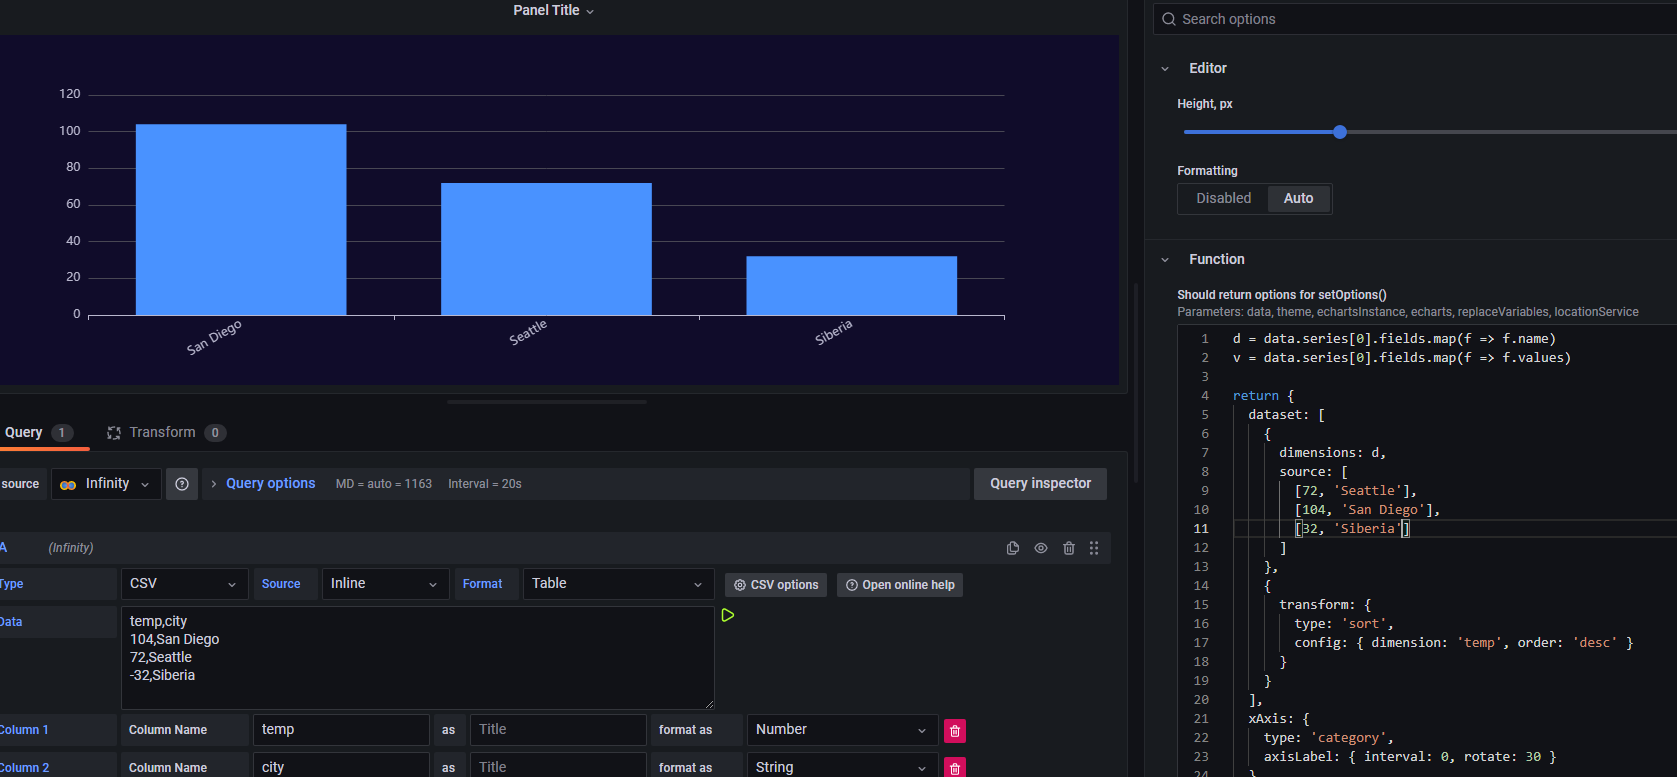
Here it is in echarts plugin using bar chart. not sure how to get the temp and city data though
Also we are still waiting for you to provide sample iot csv data
You have probably no other choice than processing the csv file to recreate the timestamp column based on your knowledge of starting date and interval. Any programing language in the terminal would work. I would go for AWK or Python…
Thanks for the tip. What do you exactly mean under terminal? Do you mean i should use Grafana CLI and modify the csv before graphing it grafana? Or is there a terminal also in grafana cloud?
This might be true for grafana, in which case that is a shortcoming IMHO. Generally speaking if the interval is regular and known, then we speak about timeseries data. Even without starting date/time it should be super easy to display the values as a line chart. Starting time is only needed to know where to place the starting point.
I am trying to insist to display my data as time series because my data is time series.
Each sensor reading is of uint16_t type (2 bytes), each timestamp would take additional 7-13 bytes, which would mean a huge waste of bandwidth and more importantly energy as the microcontroller is powered from a battery…and i transmit data over WiFi.
Let me try it once more, this link shows a sample how my board saves sensor data. As there is only 1 column i put “\n” character after each reading to start a new line. Doing so i have no commas, so it is not even csv in strict sense. Starting date and UTC time is part of my file names like that: file_YYYY_MM_DD__HH_MM_SS.txt
As there are so many options in grafana everywhere, i just hoped there is an easy way i can tell grafana the interval of the sensor readings and start time based on which grafana could reconstruct the timestamps. Seems this one is not implemented and will need to setup some ingestion function on my server to process incoming files. That way i do not need to transfer so many unnecessary bytes and still use grafana to display my data.