csktwo
December 6, 2024, 1:31pm
1
Hi All,
I have the data in excel format (in .csv) and how do I create such dashboard. Please advice.
Use Infinity plugin to parse your CSV data, than use stat panels, gauges and other visualizations to visualize parsed data as you need.
csktwo
December 9, 2024, 8:53am
3
Hi ebabeshko,
Regards,
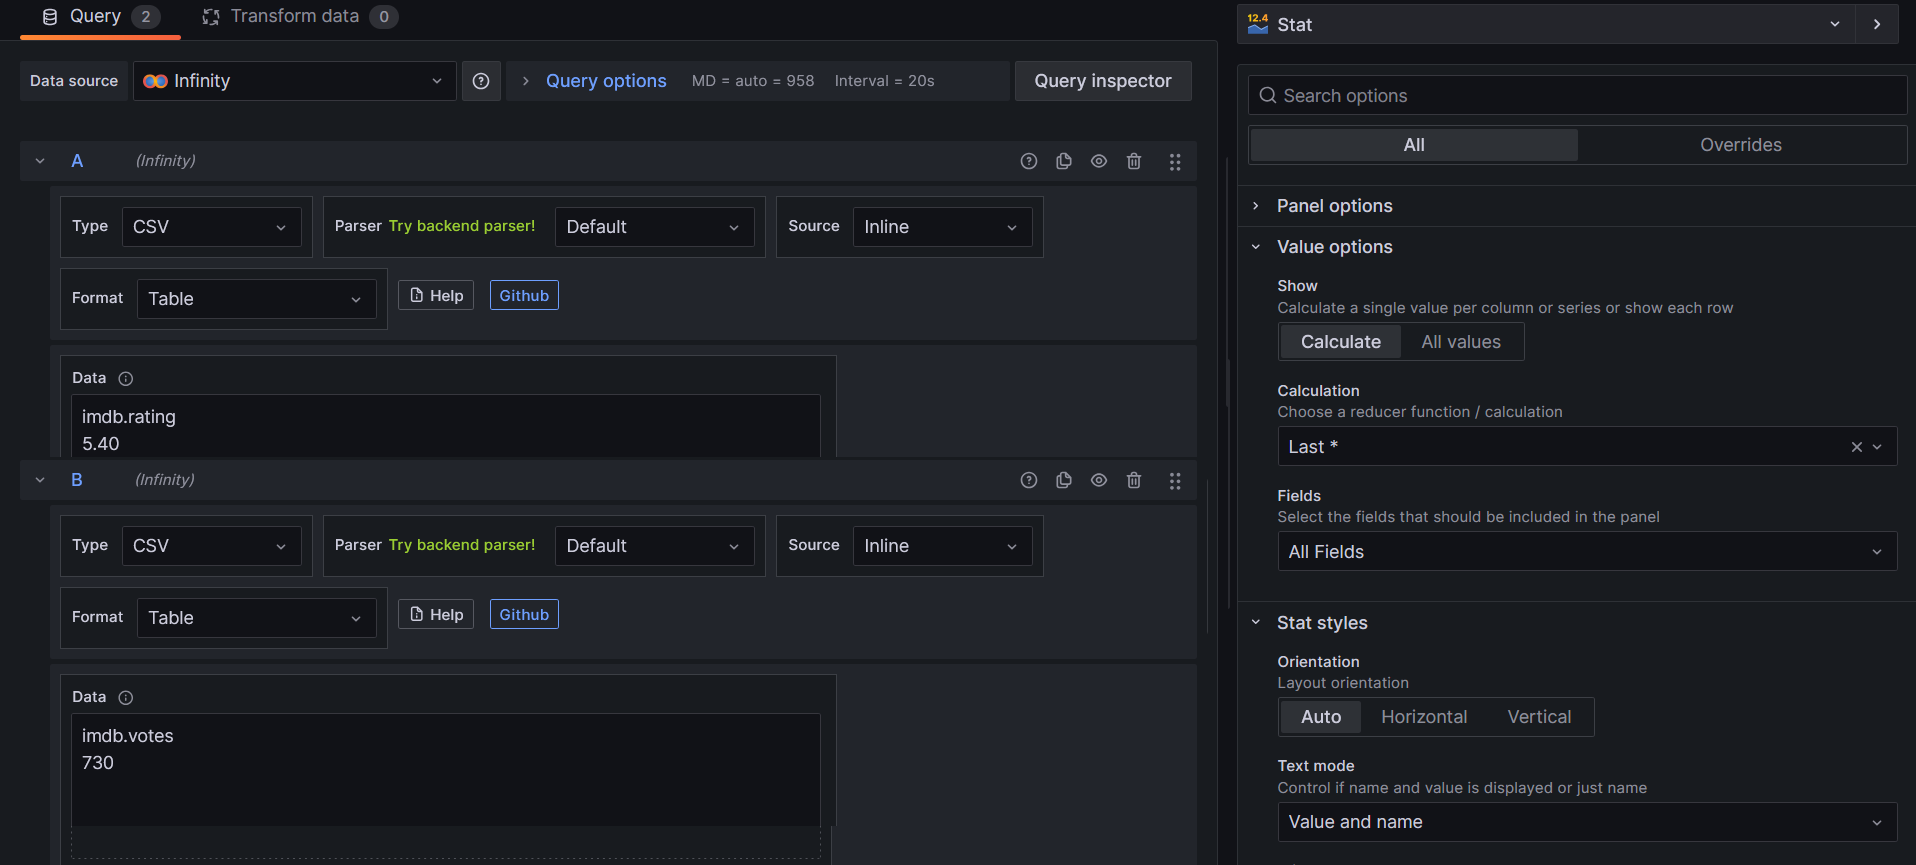
Here is an example done with 3 Stat panels and data coming from Infinity plugin:
Configuration of one of Stat panels:
csktwo
December 11, 2024, 7:30am
5
Hi ebabeshko
Metrics Overall (as on date) Current Month
Regards,
It’s not very clear for me how it relates to the original question about MongoDB-like dashboard…
Anyway, probably Table plugin would fit for your needs: