I am in Grafana V11, and I’m really struggling to get the time column from the query into the alert body. I have read through numerous topics and gone through the documentation, I have been at this for 2 days tinkering on and cannot get it to work.
I have a simple SQL query returning 2 columns, time and value for the past hour:

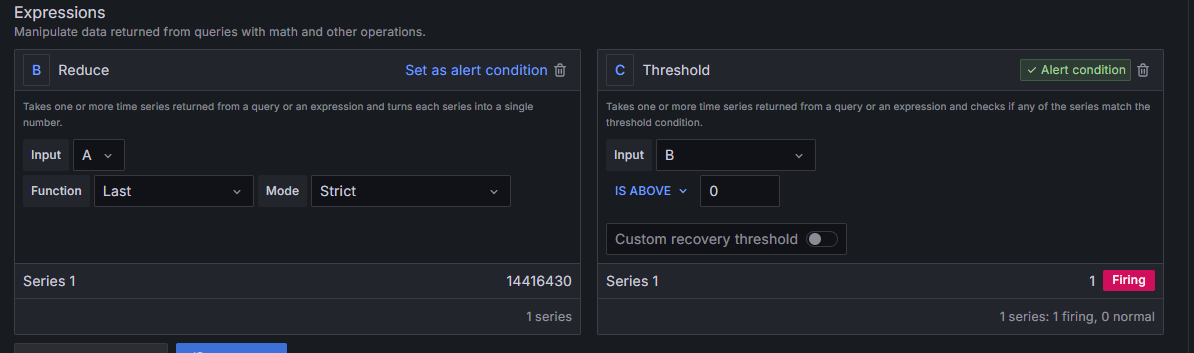
I have 2 expressions that get the last value and trigger the alert when above a threshold:
Literally all I want to do is have the alert message like this example:
Meter crossed threshold at 2025-07-30 13:02:44.607.
I have a contact point set up, and I have tried using labels and annotations but cannot seem to get the timestamp to come through. Can anyone help me do this, feel like it’s definitely possible, I just haven’t cracked it yet.
Thanks in advance.

