I can’t figure out the proper keywords for finding some guides on the tables definitions for storing the metrics.
Is it worth adding a separate table for “series” (unique tags combinations) and creating a view for grafana queries? Should I use a stored procedure for handling the new values in that “series” table (and if so, are there any examples)?
What are the best practices for handling the changes in the set of tags over time? Adding new columns (with default null) or a different set of tables?
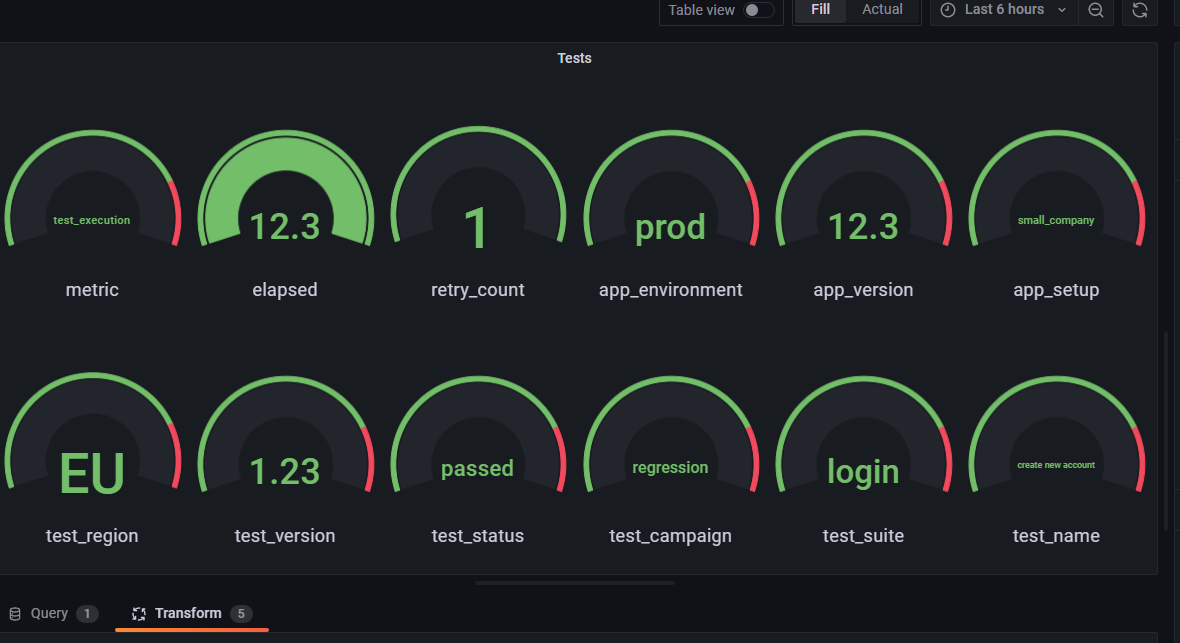
I’ll start with some functional tests, storing the execution time along with around 10 tags (some about the tests, some about the execution environment, some about the target application environment).
The data will be sent from a python script but I wasn’t able to find any examples about the postgres table structure that should hold the metrics and the associated tags.
InfluxDB would be a much better option, it’s true, but it’s not an option for the moment.
influxdb is an amazing option but other time series will also do. depends in your environment and what you feel comfortable in. up to you if you want to learn something new like influxdb. but if you are also new to postgres then I would definitely make the jump to influxdb
so what are the data points coming from your functional tests and what kind of visualization are you aiming for, what stories/insights do you want the visualization to provide you. can you please provide some
sampling of test results, if there is sensitive data just obfuscate it. the more you provide the better guidance forum can provide you. otherwise we will just prescribe placebo pill
I was hoping for something like a catalog of battle-tested solutions, to be honest. I would start with a couple of pilot projects with the corresponding dashboards and then help others to implement their own needs.
The InfluxDB schema design is a great material about fields and tags. But how should things be stored for metrics with just a few fields/tags and what should be done differently for metrics with more than 10 tags?
I mean, for any given metric I could use either distinct tables for each tag or a big “series” table (with unique combination of tags) or a few smaller tables (for subsets of tags).
Also, it’s most likely to have to reinvent a few wheels to achieve an easier reporting.
The first pilot project will provide some test executions dashboards, similar to the ones provided by Report Portal
While I could design the tables for this metric like I would do for any other application, it’s very likely to receive frequent change requests (regarding the set of collected fields/tags). Also, the future metrics could be different enough to require a different tables structure.
As such, since I strongly prefer to avoid becoming the part-time DBA for this solution, I’m looking for some best practices that could be used by everyone.
hello i think tag usage it’s more about key to groups of series , for me you should store your “tag” as “_field” (like a config series) and join on your unique execution series of a test on id