Hello,
I’m trying to send notifications to Alertmanager with the unified alerting in Grafana.
I’m actually getting a simple panel in order to know if some of my websites are down.
I’m using heartbeat, then send results in Elasticsearch, then use these results in my grafana panel. Used probe from heartbeat is “sumary.down”, and results are grouped by “url.domain” so i can get result for all of my websites. Very basic.

Then I set an alert on this panel, using the reduce operation and maths operation in order to get notified if one of my website has a “summary.down” above 0. I use these operations because I need to get the url of concerned website, and this value can’t be retrieve using classic condition. Very basic too.
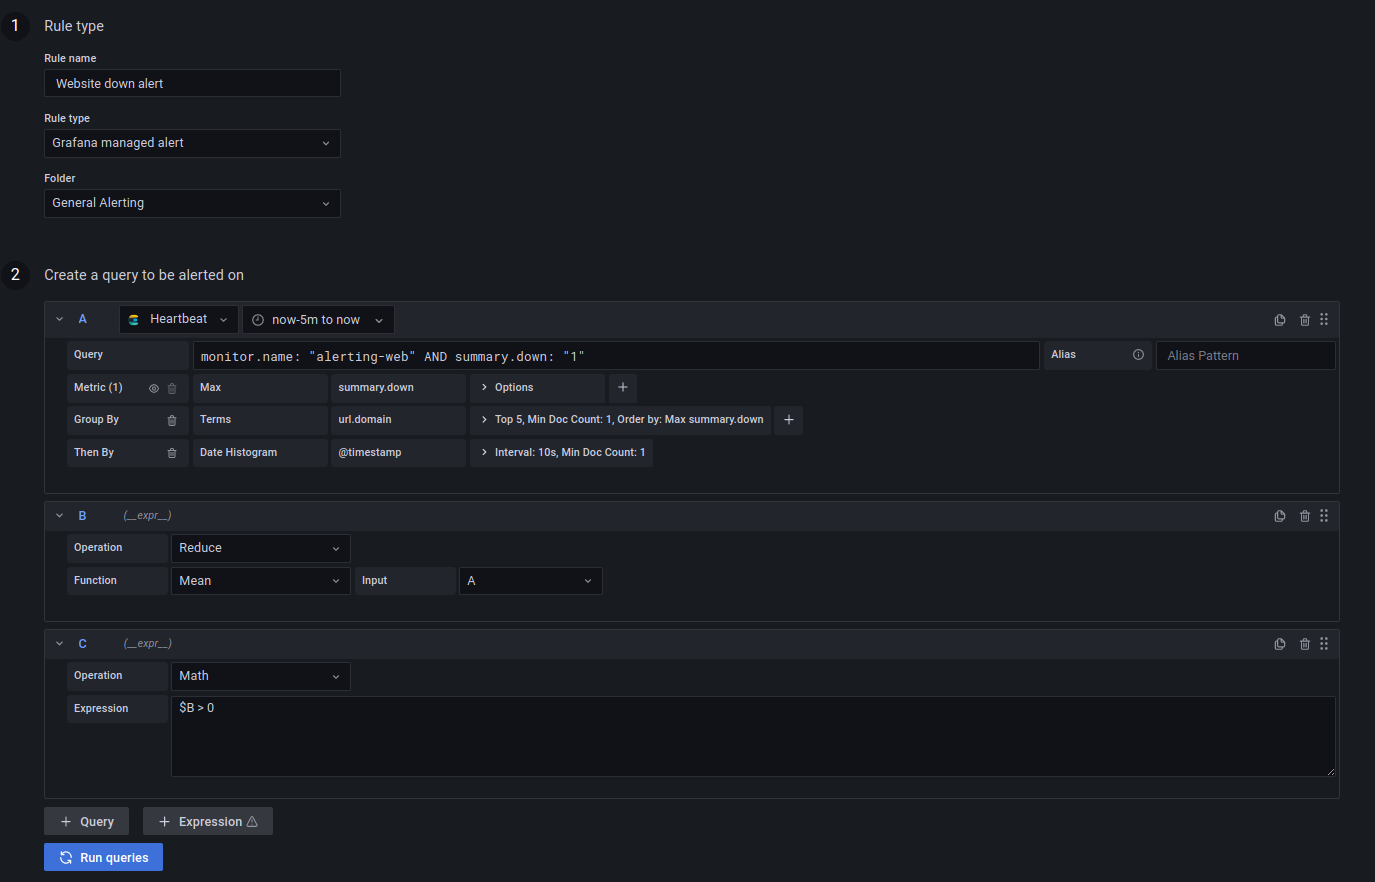
The issue i’m facing is because i group my results by “url.domain”, this field is used as a label :
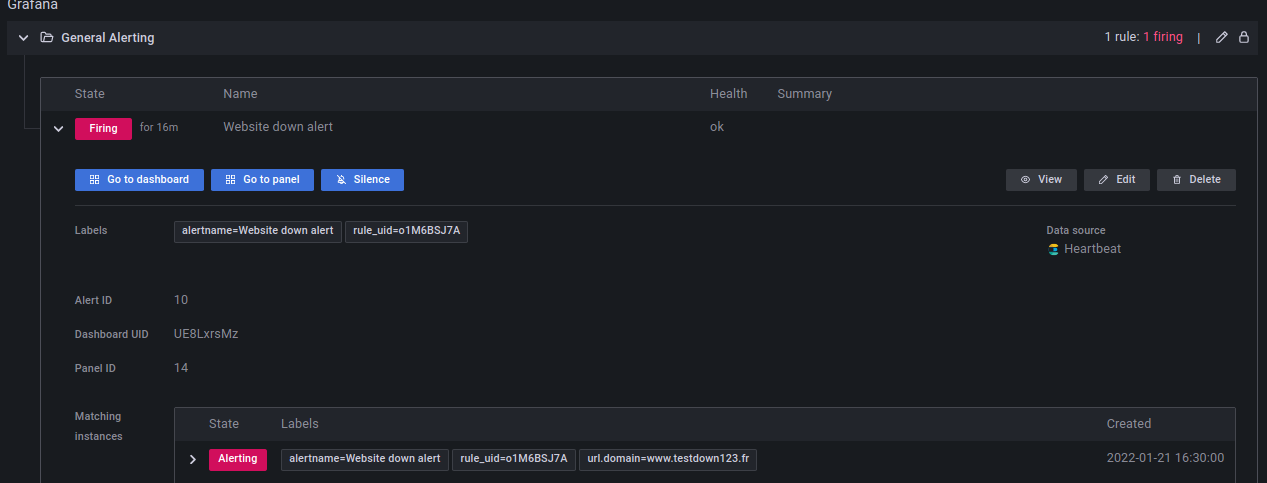
But because there is a dot in the label (url.domain), grafana raises a log error saying : “url.domain is not a valid label name” and Alertmanager never get the notification :
Jan 21 16:30:30 <MYGRAFANASERVER> grafana-server[11134]: t=2022-01-21T16:30:30+0100 lvl=info msg="level=debug component=dispatcher aggrGroup=\"{}/{alertname=\\\"Website down alert\\\"}/{}:{alertname=\\\"Website down alert\\\", url.domain=\\\"www.testdown123.fr\\\"}\" msg=flushing alerts=\"[Website down alert[13fd3bc][active]]\"" logger=alertmanager org=1
Jan 21 16:30:30 <MYGRAFANASERVER> grafana-server[11134]: t=2022-01-21T16:30:30+0100 lvl=warn msg="HTTP request failed" logger=alerting.notifier.prometheus-alertmanager url=http://<MYALERTMANAGERSERVER>:<PORT>/api/v1/alerts statusCode="400 Bad Request" body="{\"status\":\"error\",\"errorType\":\"bad_data\",\"error\":\"\\\"url.domain\\\" is not a valid label name\"}"
Jan 21 16:30:30 <MYGRAFANASERVER> grafana-server[11134]: t=2022-01-21T16:30:30+0100 lvl=warn msg="Failed to send to Alertmanager" logger=alerting.notifier.prometheus-alertmanager error="failed to send HTTP request - status code 400" alertmanager="Prometheus AlertManager2" url=http://<MYALERTMANAGERSERVER>:<PORT>/api/v1/alerts
Jan 21 16:30:30 <MYGRAFANASERVER> grafana-server[11134]: t=2022-01-21T16:30:30+0100 lvl=warn msg="All attempts to send to Alertmanager failed" logger=alerting.notifier.prometheus-alertmanager alertmanager="Prometheus AlertManager2"
Jan 21 16:30:30 <MYGRAFANASERVER> grafana-server[11134]: t=2022-01-21T16:30:30+0100 lvl=info msg="level=error component=dispatcher msg=\"Notify for alerts failed\" num_alerts=1 err=\"autogen-contact-point-1/prometheus-alertmanager[0]: notify retry canceled due to unrecoverable error after 1 attempts: failed to send alert to Alertmanager: failed to send HTTP request - status code 400\"" logger=alertmanager org=1
Does someone know how can i handle this error ?
Versions used :
Grafana : 8.3.3
Elasticsearch : 7.15.2
Heartbeat : 7.15.2