Hello,
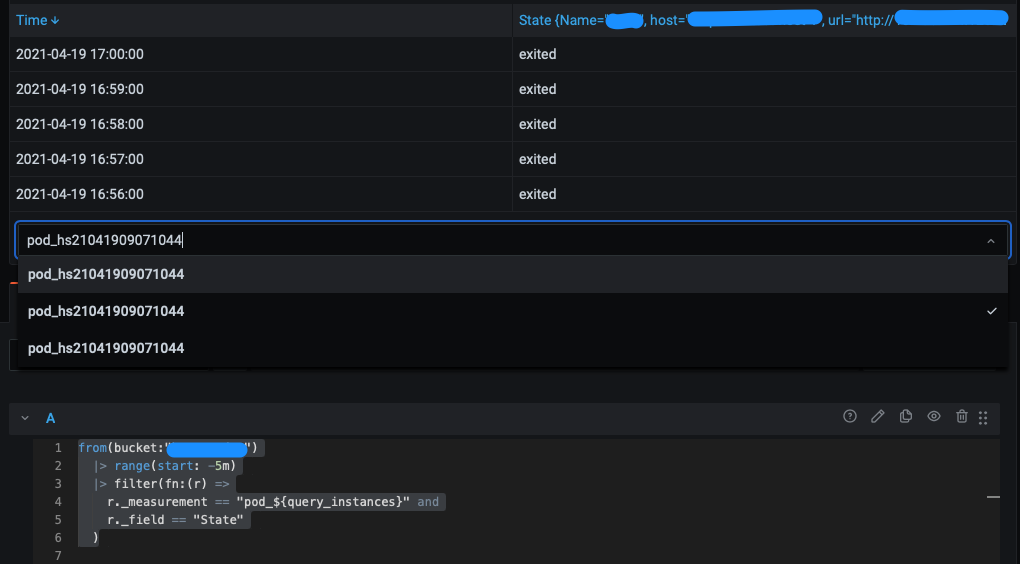
I have this query for getting status of containers in a Podman pod:
from(bucket:"testbucket")
  |> range(start: -5m)
  |> filter(fn:(r) =>
    r._measurement == "pod_name" and
    r._field == "State"
  )
The metrics have been collected by Telegraf http plugin from the Podman api and I added the custom tag “Name” and two string values “Id” and “State”.
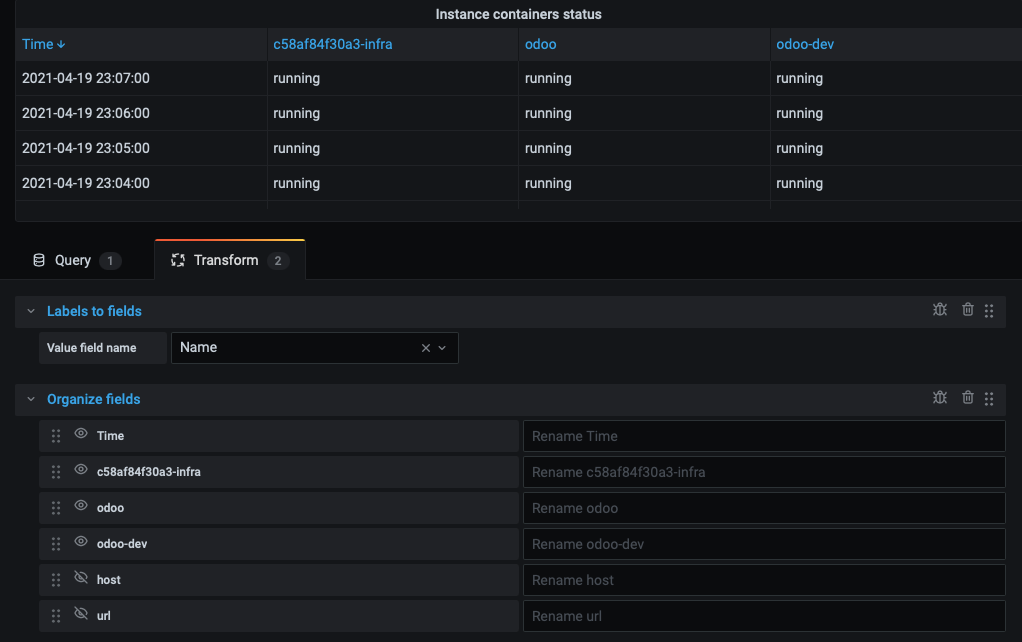
I would like to have a table with columns “time” and the names of the three containers showing their states. Instead I have columns “time”, “State” and a dropdown at the bottom what I can change the names with. How could I achieve the desired four columns version?
Thanks for any advice