I’m having an issue with grafana lately where I’m not seeing data from my prometheus and my dashboards stopped working.
I have a simple windows exporter on 2 machines and I’m using dashboard ID: 14451
Recently If i go to my dashboard the overview shows no data:

But the weird part is on prometheus the data is there.
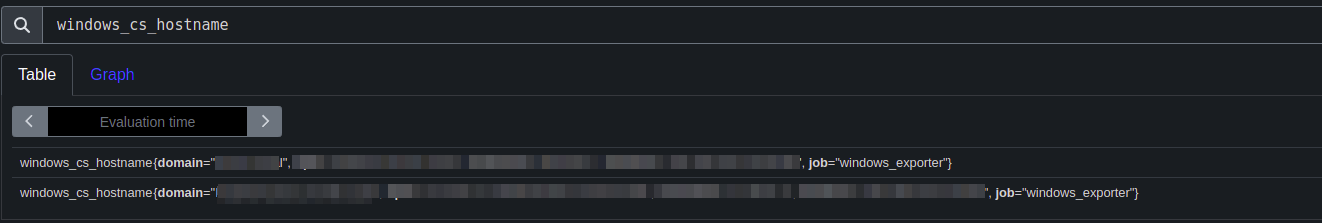
For example if I run a query for windows_cs_hostname on prometheus I get 2 results but on Grafana I get 1.
Prometheus
Grafana

I understand that the dashboard could be a dashboard issue but I don’t get why the explore is working just for 1 host although I see both of the targets fine on Prometheus.