Hi All
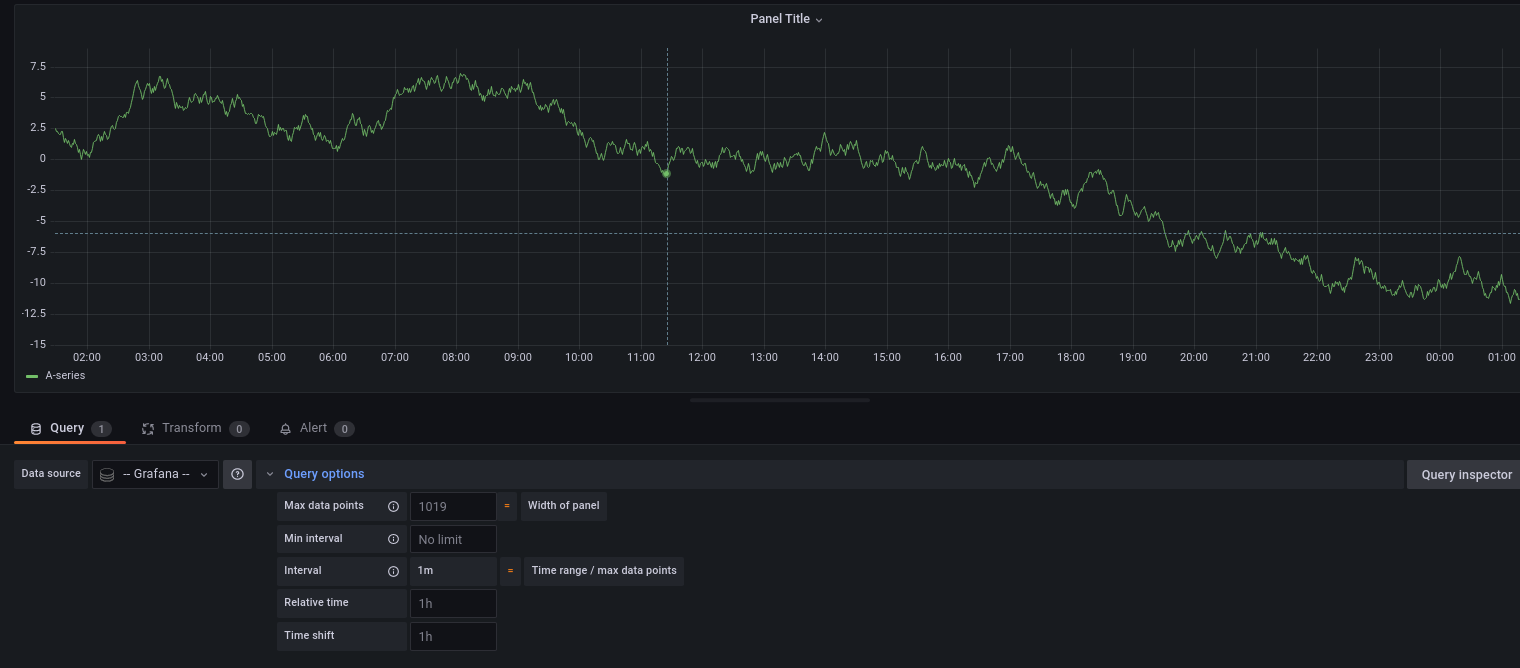
I use Grafana to display 5 minute sensor data. Over 1 day the data visualises as expected. If the period is increased to say 1 month then I get the following error
A query returned too many data points and the results have been truncated at 4521 points to prevent memory issues. At the current graph size, Grafana can only draw 452.
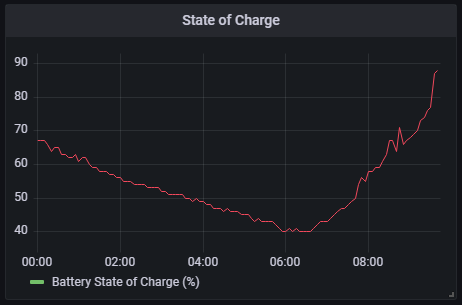
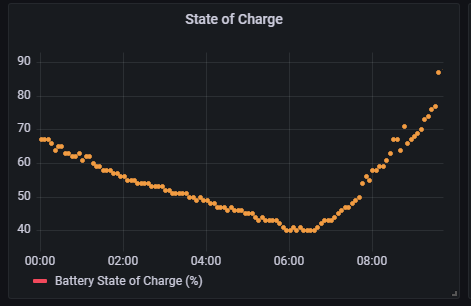
I have added aggregateWindow as per following which corrects the issue and the data displays correctly for the longer period but when I go back to 1 day time period the data is truncated and not as visaully appealing as without the aggreegateWindow function
from(bucket: "home")
  |> range(start: v.timeRangeStart, stop:v.timeRangeStop)
  |> filter(fn: (r) => r._field == "SOC")
  |> aggregateWindow(every: v.windowPeriod, fn: mean)
Outputs with and without
Is there anyway to make this more dynamic based on the time period?