Hello @grant2,
Let me explain in more detail.
I open linux cli on which influxdb 2.7.4 is running.
Then i run command : influx v1 shell.
Then i enter influx shell.
Then i run command : select * from measurement.
Then it gives below screenshot output.
The below screenshot table is the table i exactly need to see in Grafana table.

When i open influxdb web script editor and run flux command to get same data i get below screenshot.


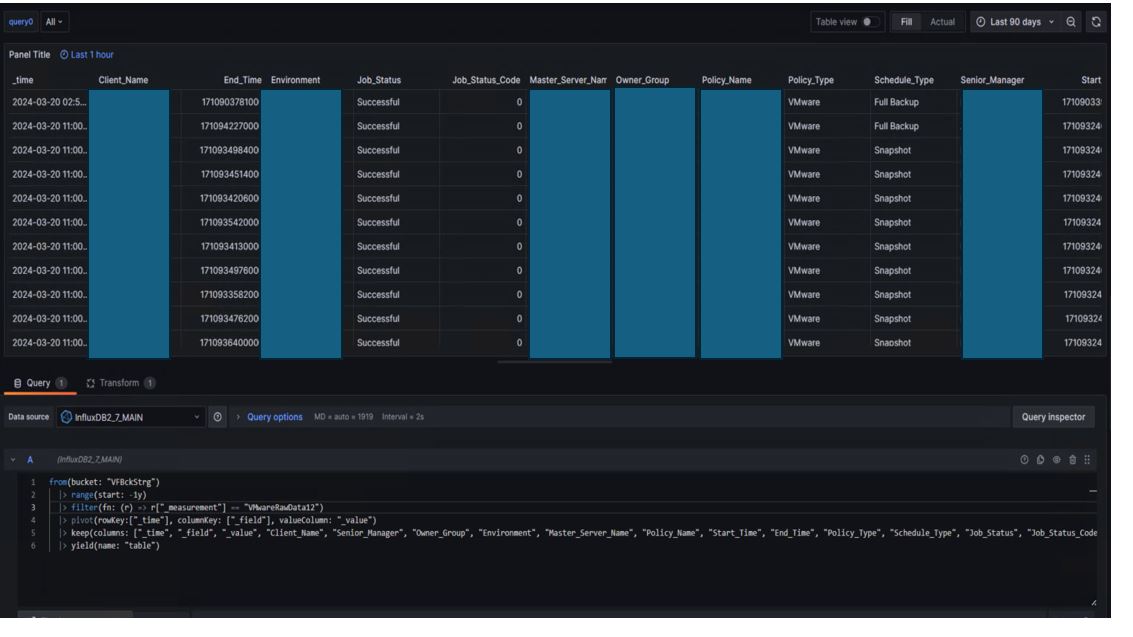
Then i enter same flux in Grafana 10 i get below scrrenshot:


While i was using influxdb 1.8 i was easily displaying table in grafana like below :
If i record everything as fields without tags i can display easily on grafana like below.
But i want to define tags for performance reasons.