Click the refresh page button, set 10 secs update frequency
No, I’ve already tested everything. There’s a problem interpreting the data.
I went to the Grafana server logs and found this:
juin 26 16:58:32 debian grafana[5944]: logger=plugin.maxmarkusprogram-prtg-datasource t=2025-06-26T16:58:32.848441417+02:00 level=error msg=“Failed to parse datetime” error=“parsing time "6/26/2025 4:00:00 PM" as "01/02/2006": cannot parse "6/26/2025 4:00:00 PM" as "01"” input=“6/26/2025 4:00:00 PM”
That must be my problem ![]()


Hello Grafana Community,
I am developing a custom Grafana datasource plugin for PRTG. I have noticed a strange issue and would like to ask for your help.
When I use the original plugin without any custom changes, everything works perfectly and I am able to connect to the PRTG API without any issues.
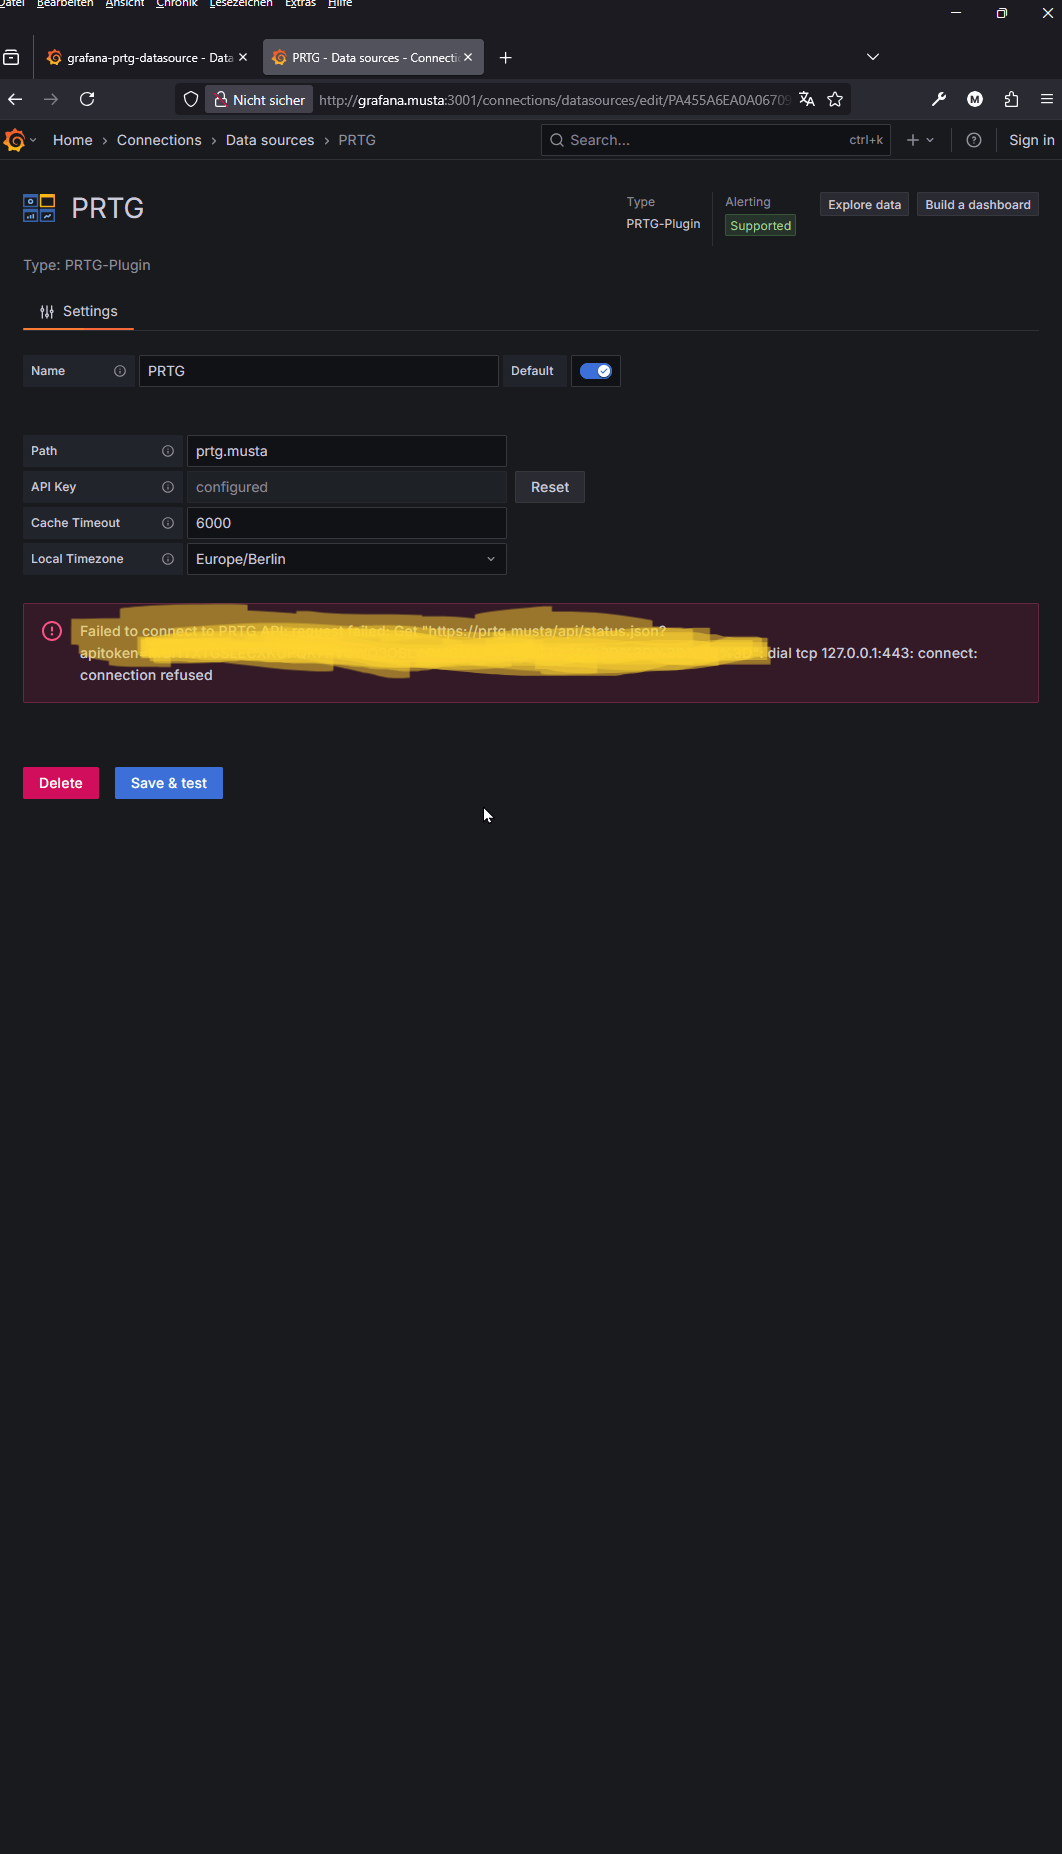
However, after I push my own customized version of the plugin to Github and apply some changes based on received feedback, I encounter the following error when I try to save and test the datasource in Grafana:
Failed to connect to PRTG API: Get “https://prtg.musta/api/status.json?…”: dial tcp 127.0.0.1:443: connect: connection refused
Some important notes:
My datasource settings (path, API key, timezone, etc.) are exactly the same in both cases.

With the original (unmodified) plugin: it works fine.

With my customized version: I get a "connection refused" error and Grafana tries to connect to 127.0.0.1:443 instead of the correct hostname.
My questions:
Why would the backend suddenly try to connect to 127.0.0.1 when the path is set as prtg.musta?

What should I check in my plugin code or configuration to avoid this issue?

Are there any common mistakes or best practices when passing the hostname/path from the frontend to the backend in custom datasource plugins?

Is there anything specific I should check in the plugin options, plugin.json, or backend code?
Any advice or suggestions would be greatly appreciated. Thank you very much for your support!
I have little knowledge about prtg for your settings. for the first time I installed the demo version on my computer to develop the grafana dasource plugin for prtg. maybe it can help me to set prtg.
Best regards,
https://youtu.be/9GbZOv7tVIQ and

I posted two videos on YouTube, the local time zone issue has been resolved, and the issue with the last 30 days and earlier has been fixed.
If you encounter any errors, please let me know.
I am having issues with installing it, this is my first try but I keep getting this error once I finished installation and try to add a new data source, and click on the PRTG plugin:
Error: Minified React error #130; visit Minified React error #130 – React for the full message or use the non-minified dev environment for full errors and additional helpful warnings.
at div
at div
at m (http://10.224.71.216:3000/public/build/53.6765d854546e5211a811.js:211:1221)
at div
at http://10.224.71.216:3000/public/build/53.6765d854546e5211a811.js:211:49624
at div
at http://10.224.71.216:3000/public/build/53.6765d854546e5211a811.js:211:49624
at div
at http://10.224.71.216:3000/public/build/53.6765d854546e5211a811.js:211:49624
at eval (http://10.224.71.216:3000/public/plugins/maxmarkusprogram-prtg-datasource/module.js?_cache=1.0.0:3:52818)
at o (http://10.224.71.216:3000/public/build/53.6765d854546e5211a811.js:1:170)
at i (http://10.224.71.216:3000/public/build/53.6765d854546e5211a811.js:192:118489)
at g (http://10.224.71.216:3000/public/build/53.6765d854546e5211a811.js:192:118998)
at div
at div
at div
at Za (http://10.224.71.216:3000/public/build/5707.996cba0f67db0165b4a5.js:124:25126)
at gn (http://10.224.71.216:3000/public/build/5707.996cba0f67db0165b4a5.js:187:4995)
at Na (http://10.224.71.216:3000/public/build/5707.996cba0f67db0165b4a5.js:124:29666)
at ms (http://10.224.71.216:3000/public/build/5707.996cba0f67db0165b4a5.js:124:29796)
at h (http://10.224.71.216:3000/public/build/53.6765d854546e5211a811.js:425:68)
at div
at z (http://10.224.71.216:3000/public/build/53.6765d854546e5211a811.js:4345:820)
at div
at du (http://10.224.71.216:3000/public/build/5707.996cba0f67db0165b4a5.js:124:30082)
at gn (http://10.224.71.216:3000/public/build/5707.996cba0f67db0165b4a5.js:187:4995)
at y (http://10.224.71.216:3000/public/build/5707.996cba0f67db0165b4a5.js:187:2689)
at Yo (http://10.224.71.216:3000/public/build/5707.996cba0f67db0165b4a5.js:124:12771)
at ht (http://10.224.71.216:3000/public/build/5707.996cba0f67db0165b4a5.js:66:950)
at Pa (http://10.224.71.216:3000/public/build/5707.996cba0f67db0165b4a5.js:124:14519)
at W (http://10.224.71.216:3000/public/build/1788.bfc60a5ad6b97985daa0.js:62:4517)
at Lr (http://10.224.71.216:3000/public/build/explore.be4f716c065eb7748d1d.js:412:1445)
at div
at r (http://10.224.71.216:3000/public/build/53.6765d854546e5211a811.js:212:36848)
at div
at ve (http://10.224.71.216:3000/public/build/explore.be4f716c065eb7748d1d.js:1:12194)
at div
at div
at div
at oe (http://10.224.71.216:3000/public/build/5707.996cba0f67db0165b4a5.js:124:36597)
at m (http://10.224.71.216:3000/public/build/53.6765d854546e5211a811.js:192:29690)
at div
at div
at Co (http://10.224.71.216:3000/public/build/explore.be4f716c065eb7748d1d.js:1:9553)
at Ri (http://10.224.71.216:3000/public/build/explore.be4f716c065eb7748d1d.js:628:3974)
at Pt (http://10.224.71.216:3000/public/build/5707.996cba0f67db0165b4a5.js:183:99307)
at WithTheme(Connect(Ri))
at div
at div
at div
at oe (http://10.224.71.216:3000/public/build/5707.996cba0f67db0165b4a5.js:124:36597)
at m (http://10.224.71.216:3000/public/build/53.6765d854546e5211a811.js:192:29690)
at Di (http://10.224.71.216:3000/public/build/explore.be4f716c065eb7748d1d.js:634:32)
at Pt (http://10.224.71.216:3000/public/build/5707.996cba0f67db0165b4a5.js:183:99307)
at i (http://10.224.71.216:3000/public/build/53.6765d854546e5211a811.js:192:118489)
at g (http://10.224.71.216:3000/public/build/53.6765d854546e5211a811.js:192:118998)
at div
at i (http://10.224.71.216:3000/public/build/1788.bfc60a5ad6b97985daa0.js:1:2295)
at div
at i (http://10.224.71.216:3000/public/build/1788.bfc60a5ad6b97985daa0.js:1:4280)
at J (http://10.224.71.216:3000/public/build/1788.bfc60a5ad6b97985daa0.js:1:9618)
at div
at Bi (http://10.224.71.216:3000/public/build/explore.be4f716c065eb7748d1d.js:634:2456)
at Suspense
at i (http://10.224.71.216:3000/public/build/53.6765d854546e5211a811.js:192:118489)
at cg (http://10.224.71.216:3000/public/build/53.6765d854546e5211a811.js:5680:8041)
at de (http://10.224.71.216:3000/public/build/5707.996cba0f67db0165b4a5.js:228:23610)
at Eo (http://10.224.71.216:3000/public/build/5707.996cba0f67db0165b4a5.js:209:4728)
at zn (http://10.224.71.216:3000/public/build/5707.996cba0f67db0165b4a5.js:209:10219)
at Xu (http://10.224.71.216:3000/public/build/5707.996cba0f67db0165b4a5.js:228:11773)
at de (http://10.224.71.216:3000/public/build/5707.996cba0f67db0165b4a5.js:228:25805)
at div
at div
at main
at div
at qf (http://10.224.71.216:3000/public/build/53.6765d854546e5211a811.js:5680:2407)
at Eo (http://10.224.71.216:3000/public/build/5707.996cba0f67db0165b4a5.js:209:4728)
at zn (http://10.224.71.216:3000/public/build/5707.996cba0f67db0165b4a5.js:209:10219)
at dn (http://10.224.71.216:3000/public/build/5707.996cba0f67db0165b4a5.js:209:9608)
at hc (http://10.224.71.216:3000/public/build/5707.996cba0f67db0165b4a5.js:228:12072)
at de (http://10.224.71.216:3000/public/build/5707.996cba0f67db0165b4a5.js:228:19776)
at div
at o (http://10.224.71.216:3000/public/build/53.6765d854546e5211a811.js:212:13720)
at v (http://10.224.71.216:3000/public/build/5707.996cba0f67db0165b4a5.js:41:14074)
at p (http://10.224.71.216:3000/public/build/5707.996cba0f67db0165b4a5.js:659:220508)
at l (http://10.224.71.216:3000/public/build/53.6765d854546e5211a811.js:566:21354)
at i (http://10.224.71.216:3000/public/build/53.6765d854546e5211a811.js:192:118489)
at g (http://10.224.71.216:3000/public/build/53.6765d854546e5211a811.js:192:118998)
at Me (http://10.224.71.216:3000/public/build/5707.996cba0f67db0165b4a5.js:187:529)
at ug (http://10.224.71.216:3000/public/build/53.6765d854546e5211a811.js:5691:122)
Any ideas?
This is the corresponding grafana log:
logger=context userId=1 orgId=1 uname=admin t=2025-07-02T11:55:11.874400997-04:00 level=info msg=“Request Completed” method=GET path=/api/gnet/plugins/maxmarkusprogram-prtg-datasource status=404 remote_addr=172.18.151.172 time_ms=54 duration=54.587404ms size=116 referer=http://10.224.71.216:3000/connections/datasources/edit/c7352289-748c-4418-b6cd-518f8bb145bc handler=/api/gnet/*
![]() Enable Unsigned Plugin in Grafana (Dev Mode)
Enable Unsigned Plugin in Grafana (Dev Mode)
To allow Grafana to load your custom (unsigned) plugin during development, follow these steps:
⸻
![]() Step 1: Edit grafana.ini
Step 1: Edit grafana.ini
Locate and open the grafana.ini configuration file. Then, add or edit the following under the [plugins] section:
[plugins]
allow_loading_unsigned_plugins = maxmarkusprogram-prtg-datasource
Make sure the value matches the id field in your plugin’s plugin.json:
“id”: “maxmarkusprogram-prtg-datasource”
⸻
![]() Where is grafana.ini?
Where is grafana.ini?
• Linux: /etc/grafana/grafana.ini
• Windows: C:\Program Files\GrafanaLabs\grafana\conf\grafana.ini
• Docker: Set it via an environment variable:
-e GF_PLUGINS_ALLOW_LOADING_UNSIGNED_PLUGINS=maxmarkusprogram-prtg-datasource
⸻
2 Restart Grafana
Good evening, everyone. I installed the plugin on the latest version of Grafana 12.0.2 running Ubuntu, and the API isn’t connecting to my PRTG server.
I modified the Default.ini on my Grafana server, and it still isn’t connecting.
The error is: Plugin status check failed.
I’m leaving a screenshot to see if you can help me. Thank you very much!

Restart Grafana service and try to test again. If you test more than once it outputs that error. Each time you test, the next time you have to restart the service first.
If you check the grafana logs you will find that it gives a critical error.

I know that this might sound silly, but confirm that the servers have the same time zones too. I had something similar, and the Grafana server was in the incorrect timezone.
#This is how I fixed the timezone issue when I encountered it. I have yet to update to the latest plugin.
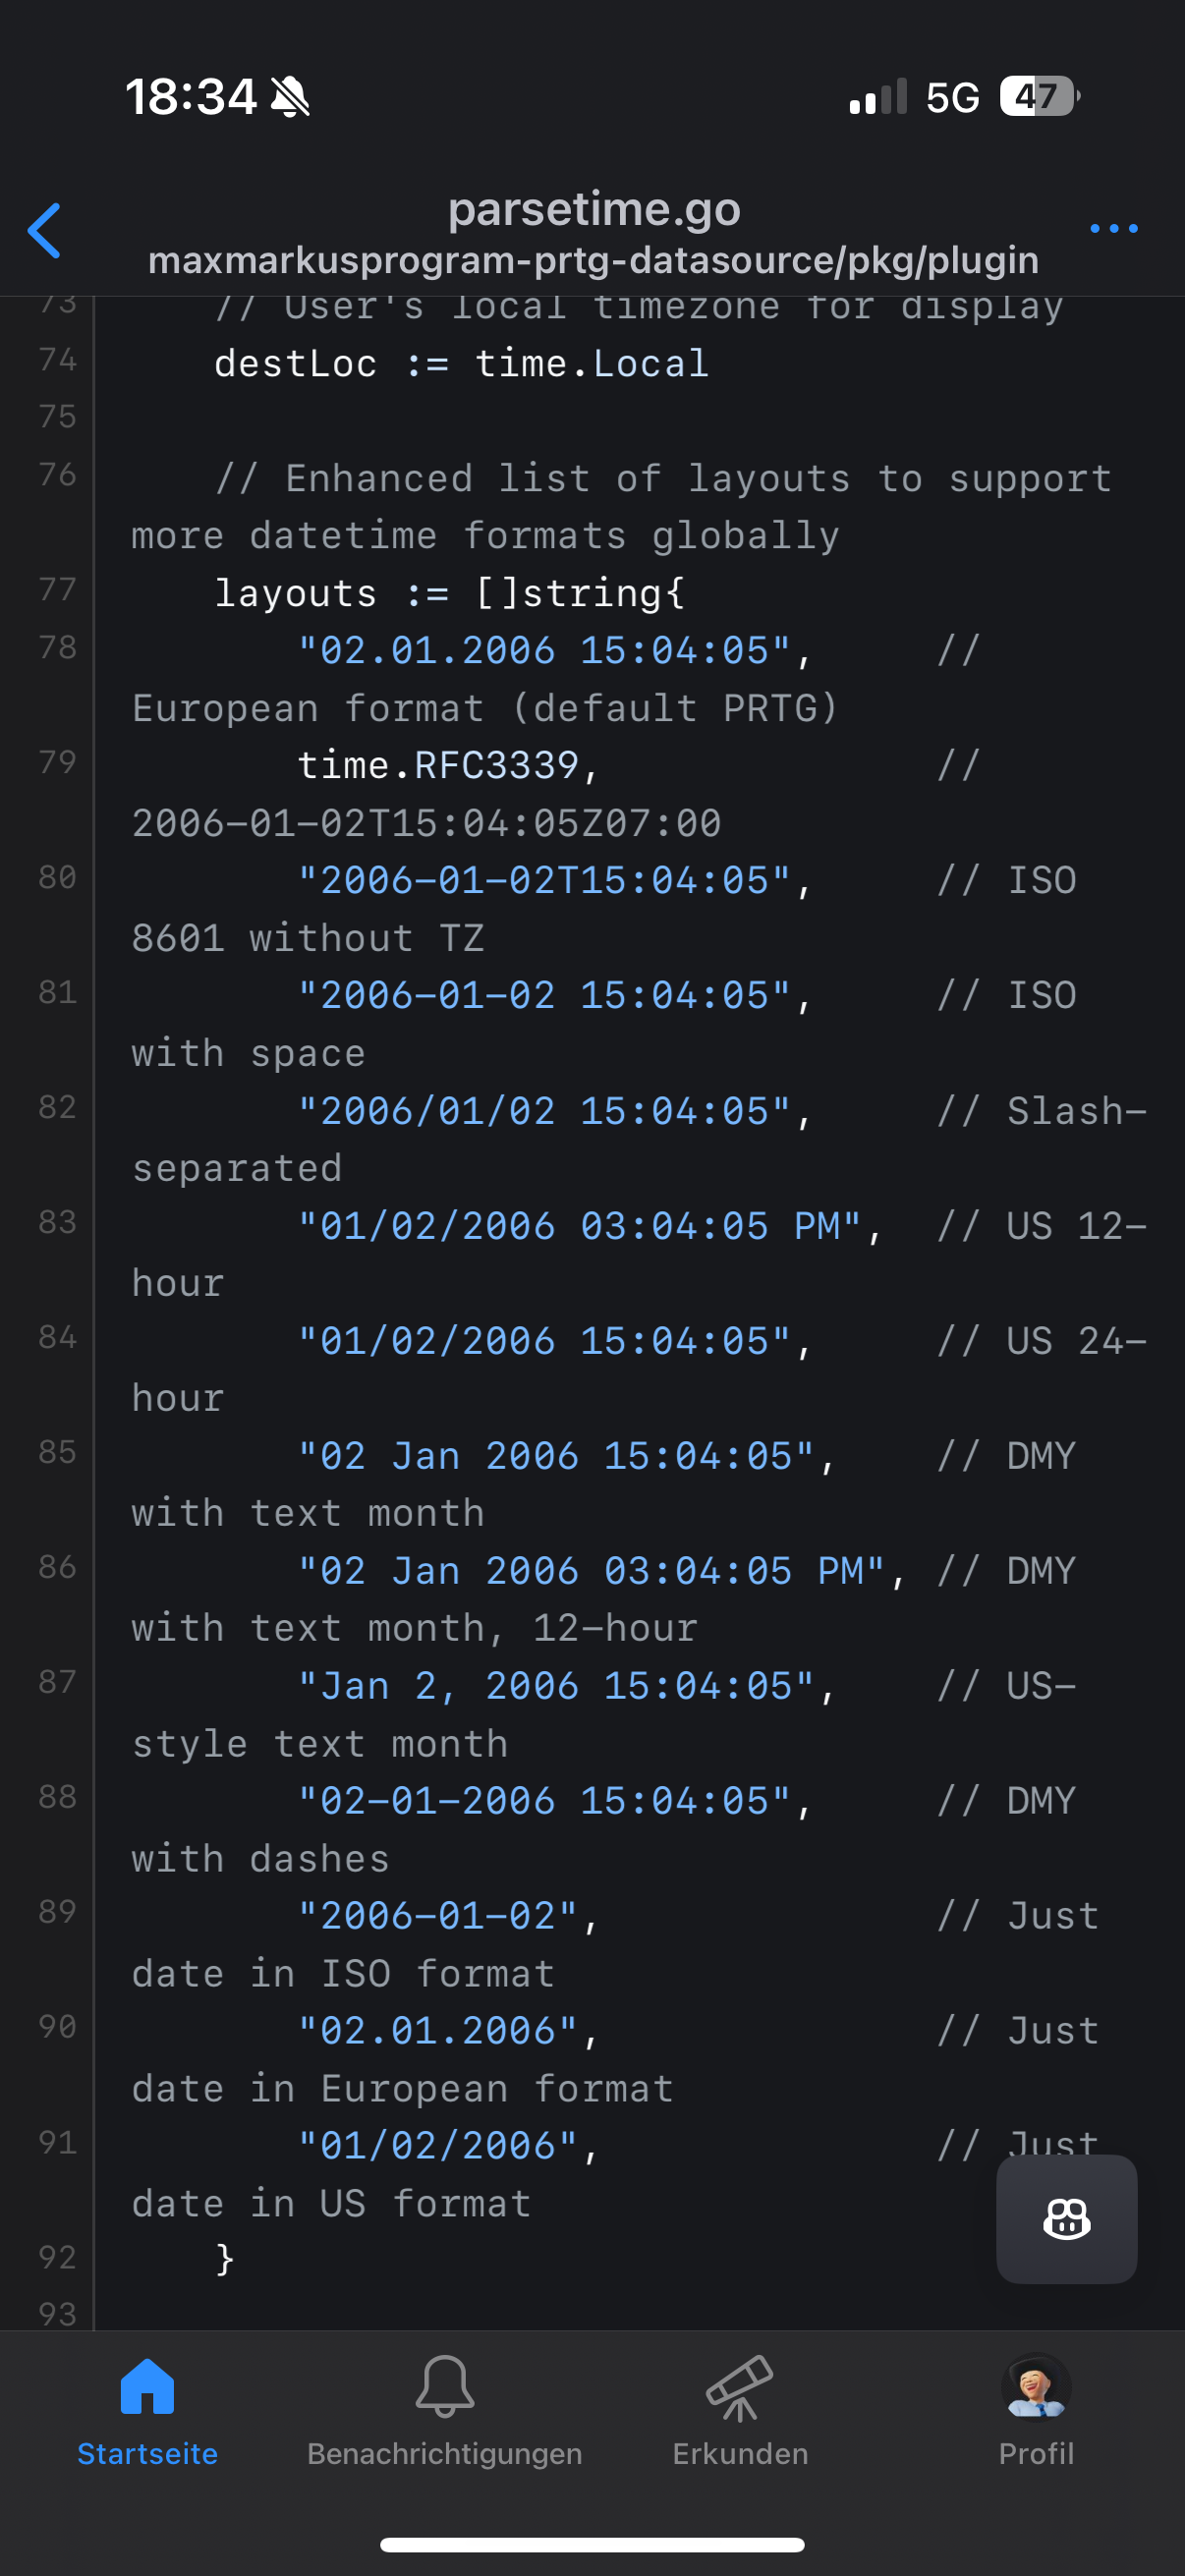
#Find the function parsePRTGDateTime and replace the block of code with this. I hope this helps.
###############################################################################################
func parsePRTGDateTime(datetime string) (time.Time, string, error) {
if strings.Contains(datetime, " - ") {
parts := strings.Split(datetime, " - ")
if len(parts) == 2 {
datetime = strings.TrimSpace(parts[1])
}
}
layouts := []string{
time.RFC3339, // 2006-01-02T15:04:05Z07:00
"2006-01-02T15:04:05", // ISO 8601 without TZ
"2006-01-02 15:04:05", // ISO with space
"2006/01/02 15:04:05", // Slash-separated
"01/02/2006 03:04:05 PM", // US 12-hour
"01/02/2006 15:04:05", // US 24-hour
"02 Jan 2006 15:04:05", // DMY with text month
"02 Jan 2006 03:04:05 PM", // DMY with text month, 12-hour
"Jan 2, 2006 15:04:05", // US-style text month
"02-01-2006 15:04:05", // DMY with dashes
}
loc, err := time.LoadLocation("Europe/Berlin") // or "America/New_York" for US
if err != nil {
loc = time.Local
}
var parseErr error
for _, layout := range layouts {
parsedTime, err := time.ParseInLocation(layout, datetime, loc)
if err == nil {
utcTime := parsedTime.UTC()
return utcTime, strconv.FormatInt(utcTime.Unix(), 10), nil
}
parseErr = err
}
backend.Logger.Error("Date parsing failed", "datetime", datetime, "error", parseErr)
return time.Time{}, "", fmt.Errorf("failed to parse time '%s': %w", datetime, parseErr)
}
###############################################################################################
(post deleted by author)
Hey, I got it working in Windows. For some reason RH 9 keeps giving me a lot of errors with SELinux and at this point, I don’t have time to troubleshoot those. The one thing that I would like to request as a feature (unless it is something I am doing wrong) is the ability to perform queries in more than a single device/sensor. If I try, for example, to monitor the status of an entire group, it will not allow to use the “*” placeholder. I have a group of around 200 devices on the field that I would like to monitor in real time from Ping and HTTP sensors, and I have to add them one by one since I can’t monitor an entire group. Let me know if you need any logs or data that can be useful if you think this is a bug.
# Steps for Multiple Grafana Organizations using the maxmarkusprogram-prtg-datasource.
# Using the same plugin in multiple Grafana organizations will lead to errors, hence the need to duplicate the plugin.
# If you need to use the plugin in more than one Grafana organization, you can follow these steps to set up a duplicate PRTG plugin under the same Grafana instance.

# Step 1
cd /tmp # Change to temporary directory
git clone https://github.com/1DeliDolu/PRTG.git # Clone the PRTG plugin repository
sudo mv /tmp/PRTG/maxmarkusprogram-prtg-datasource /var/lib/grafana/plugins/PRTG-ORG2 # Move the plugin to Grafana's plugin directory
sudo chown -R grafana:grafana /var/lib/grafana/plugins/PRTG-ORG2 # Set ownership to Grafana user and group

# Step 2: Build the plugin (frontend)
cd /var/lib/grafana/plugins/PRTG-ORG2 # Change to the plugin directory
npm install # Install Node.js dependencies
npm run build # Build the frontend assets for the plugin

# Step 3: Build the Go backend binary
mkdir -p dist # Create a directory for the binary
go build -o dist/gpx_prtg_linux_amd64 ./pkg # Compile the Go backend binary
chmod +x dist/gpx_prtg_linux_amd64 # Make the binary executable

# Step 4: Update Plugin Metadata. Edit the plugin.json file to give the plugin a unique name and ID. Important: The id must be unique across all plugins in Grafana.
sudo nano /var/lib/grafana/plugins/PRTG-ORG2/plugin.json # Open the plugin.json file in nano editor
Update
{
  "name": "PRTG", # Change the name to something unique for the new plugin
  "id": "maxmarkusprogram-prtg-datasource", # Change the ID to a unique identifier for the new plugin
  ...
}

# Step 5: Update grafana.ini to include new Grafana Organization PRTG plugin (Verify this is update in nano /etc/grafana/grafana.ini)
[plugins]
allow_loading_unsigned_plugins = maxmarkusprogram-prtg-datasource,<new Plugin name> # Allow loading of unsigned plugin by ID

# Step 6: Restart Grafana-Server
sudo systemctl restart grafana-server

# Step 7: Add the new datasource in the Grafana UI. Search using the specified id/name from Step 4
Home>Connections>Data sources>Add data source
thank you very much


Try switching to YYYY-MM-DD


Can you try re-cloning the plugin to get the new improvement? The timezone configuration should now be part of the datasource settings. Thank you @maxmarkusprogram
