Hi,
I have developed a Grafana datasource plugin with backend for PRTG. The repository is attached. This plugin is open-source and can be used by those who utilize Grafana.
I have shared the code with Grafana to publish it as a data source plugin. If there are any PRTG users interested in testing or providing feedback, I would greatly appreciate it.
This is my first project, and I am still quite new to Grafana—I started learning it about three months ago.
Thank you in advance for your time and feedback!
GitHub Repository: "[github](https://github.com/1DeliDolu/PRTG.git)
I’ll give this a go. Thank you!
Hopefully, Grafana picks it up and integrates it, as they haven’t provided an official plugin for PRTG.
Great! Have you had a chance to try it out yet? Any updates on whether Grafana has picked it up and integrated it?"
Yes. I tried it and it works great. Any feedback from Grafana on getting it published and signed?
Would be very interrested in trying out but not familiar at all with linux, go and building.
Any chance to get a ready-to-install plugin file for Grafana running on Windows?
I have written a script to install it on an Ubuntu server. This performs the Grafana server (OSS/Enterprise) installation and plugin installation in one copy-and-paste operation. If you want to give it a go on Linux let me know.
 Manual Installation of a Grafana Plugin (Using PowerShell)
 Clone or update the repository
powershell
To clone the repository:
git clone https://github.com/maxmarkusprogram/prtg-datasource.git
If you already have it:
git pull
-
 Navigate to the plugin folder
powershell
cd PRTG/maxmarkusprogram-prtg-datasource
-
 Stop the Grafana service
powershell
net stop grafana
-
 Copy the plugin folder to Grafana’s plugin directory
powershell
Copy-Item -Path .\maxmarkusprogram-prtg-datasource -Destination “C:\Program Files\GrafanaLabs\grafana\data\plugins” -Recurse -Force
-
 Allow unsigned plugins in Grafana
 Recommended: Edit custom.ini instead of defaults.ini to avoid overwriting on update.
Open custom.ini:
notepad “C:\Program Files\GrafanaLabs\grafana\conf\custom.ini”
Add or modify the [plugins] section like this:
[plugins]
allow_loading_unsigned_plugins = maxmarkusprogram-prtg-datasource
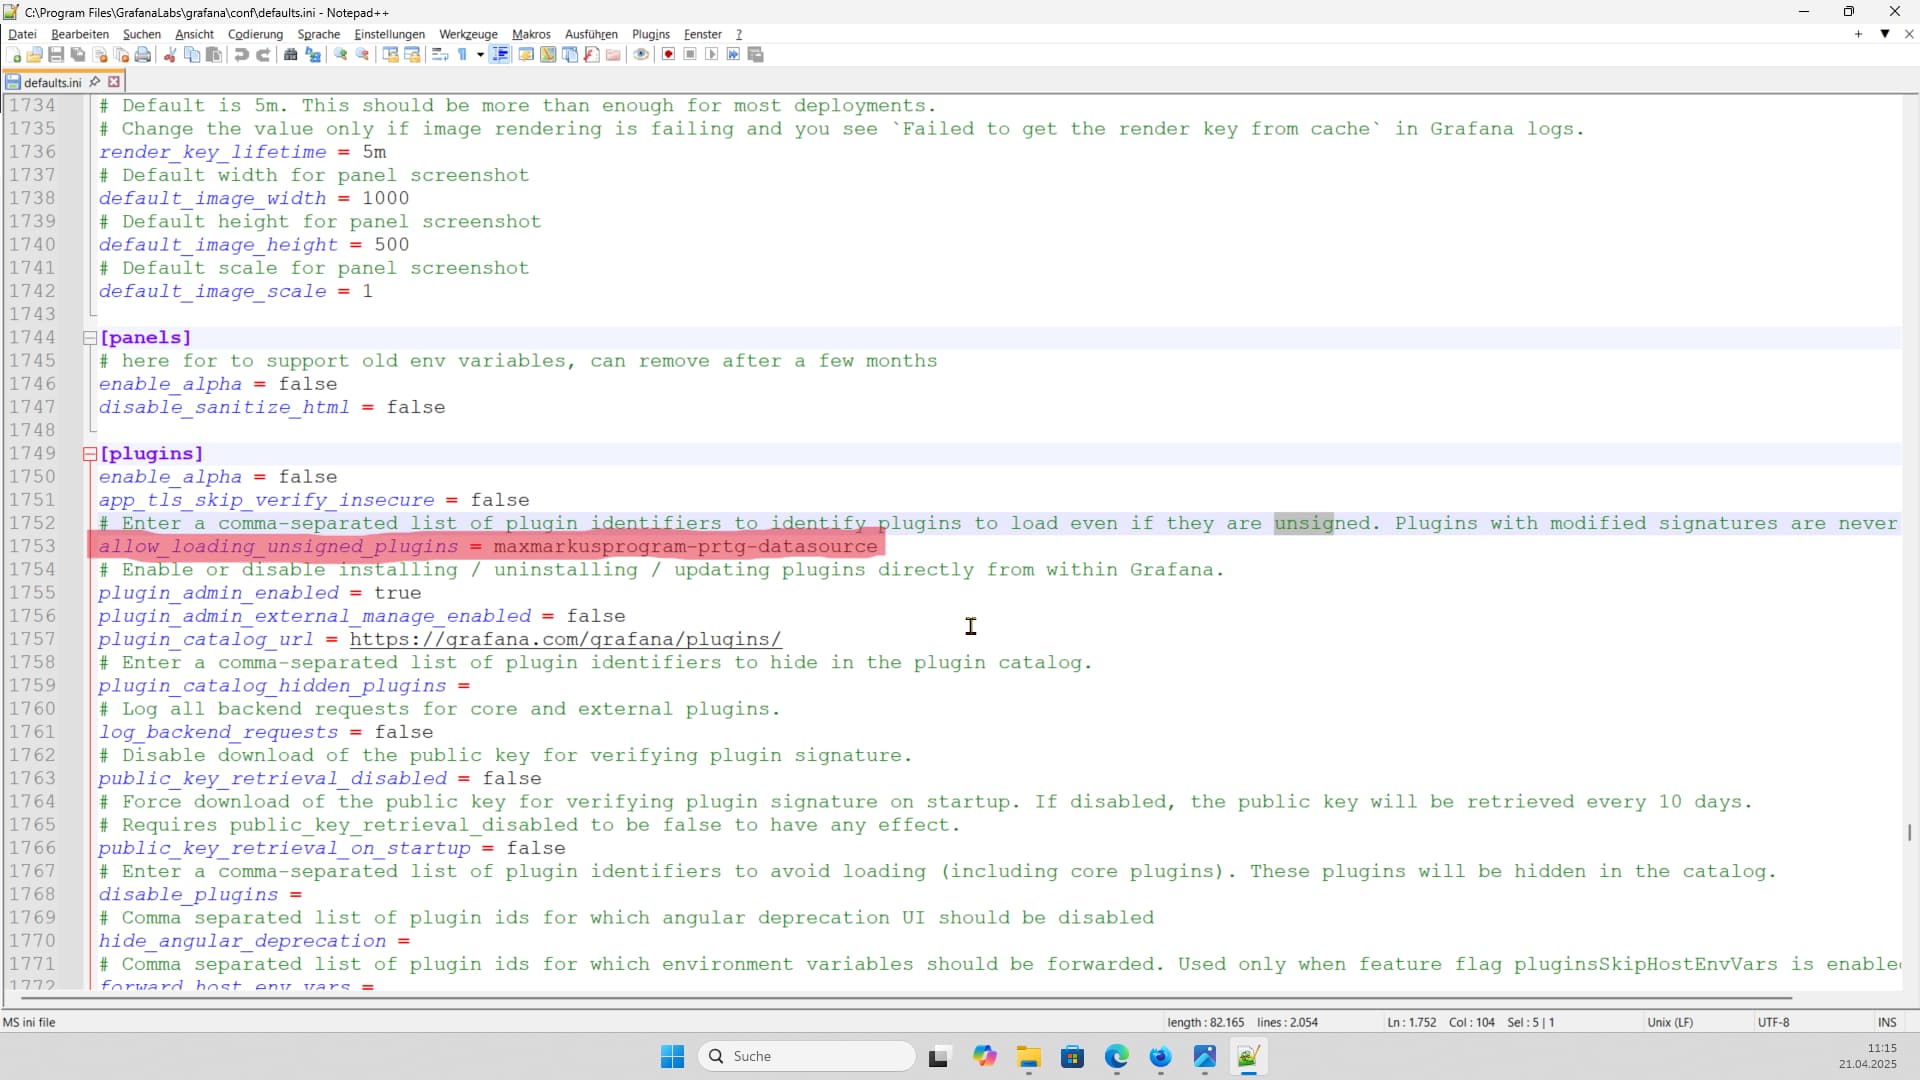
If you must edit defaults.ini ( not recommended), do the same change in:
C:\Program Files\GrafanaLabs\grafana\conf\defaults.ini
-
 Start the Grafana service
powershell
net start grafana
-
 Open Grafana in your browser
Open this URL:
http://localhost:3000
Please share your script - not sure if I want to go the full docker route for installation. Thanks.
# Requirements:
# - Ensure the script is run with root privileges (I used `sudo -i`).
# - Internet access is required for downloading dependencies and repositories.
# - Verify the Grafana configuration file changes using a text editor (e.g., nano).
# - The datasource requires only the server name, no HTTP/S or /api at the end, in Grafana UI
# Steps Overview:
# 1. Update the system and install essential packages (git, curl, build-essential, Go, and UFW).
# 2. Install Node.js version 18, required for building the plugin's frontend.
# 3. Enable and configure the firewall to allow SSH and Grafana's default port (3000).
# 4. Install Grafana Enterprise and enable its service to start on boot.
# 5. Clone the PRTG plugin repository and move it to Grafana's plugin directory.
# 6. Build the plugin's frontend using npm.
# 7. Compile the Go backend binary for the plugin.
# 8. Patch the Grafana configuration file to allow unsigned plugins and set the correct plugin path.
# 9. Restart the Grafana server to apply changes.
# - If the configuration patching in Step 8 fails, manually update the `grafana.ini` file with the required settings.
#I have also installed this on Grafana 12, which was just released, and it runs well.


# Step 1: Update & install essentials
sudo apt update
sudo apt install -y git curl build-essential golang ufw

# Step 2: Install Node.js
curl -fsSL https://deb.nodesource.com/setup_18.x | sudo -E bash -
sudo apt install -y nodejs

# Step 3: Enable firewall
sudo ufw --force enable
sudo ufw allow ssh
sudo ufw allow 3000/tcp

# Step 4: Install Grafana Enterprise
sudo apt-get install -y apt-transport-https software-properties-common wget
sudo mkdir -p /etc/apt/keyrings/

wget -q -O - https://apt.grafana.com/gpg.key | gpg --dearmor | sudo tee /etc/apt/keyrings/grafana.gpg > /dev/null

echo "deb [signed-by=/etc/apt/keyrings/grafana.gpg] https://apt.grafana.com stable main" | sudo tee -a /etc/apt/sources.list.d/grafana.list

sudo apt update
sudo apt-get install grafana-enterprise
sudo systemctl enable --now grafana-server

# Step 5: Download and move the plugin
cd /tmp
git clone https://github.com/1DeliDolu/PRTG.git
sudo mv /tmp/PRTG/maxmarkusprogram-prtg-datasource /var/lib/grafana/plugins/PRTG
sudo chown -R grafana:grafana /var/lib/grafana/plugins/PRTG

# Step 6: Build the plugin (frontend)
cd /var/lib/grafana/plugins/PRTG
npm install
npm run build

# Step 7: Build the Go backend binary
mkdir -p dist
go build -o dist/gpx_prtg_linux_amd64 ./pkg
chmod +x dist/gpx_prtg_linux_amd64

# Step 8: Patch grafana.ini (Verify this is update in nano /etc/grafana/grafana.ini)
sudo sed -i '/^\[plugins\]/,/^\[/ s/^;*allow_loading_unsigned_plugins.*/allow_loading_unsigned_plugins = maxmarkusprogram-prtg-datasource/' /etc/grafana/grafana.ini

sudo sed -i '/^\[plugins\]/,/^\[/ s/^;*disable_plugin_signature_check.*/disable_plugin_signature_check = true/' /etc/grafana/grafana.ini

sudo sed -i '/^\[paths\]/,/^\[/ s/^;*plugins.*/plugins = \/var\/lib\/grafana\/plugins/' /etc/grafana/grafana.ini

# Step 9: Restart Grafana
sudo systemctl restart grafana-server

#The end.
------------------------------------------------------------------------------------

#Add the below manually if step 8 does not do it.
[plugins]
# Allow loading of unsigned plugin by ID
allow_loading_unsigned_plugins = maxmarkusprogram-prtg-datasource
# (Optional but helps avoid startup signature errors)
disable_plugin_signature_check = true
[paths]
# (Optional override, ensures Grafana uses correct plugin path)
plugins = /var/lib/grafana/pluginsPreformatted text
Thanks for the plugin. We have a relatively large PRTG installation and were using the old JasonLashua PRTG plugin, which relied on AngularJS and has since been deprecated. Hence, we are at an impasse on what to use. So this is very helpful.
We have implemented your plugin on a Grafana 12.0.1 installed on a Windows machine. The plugin, while it is working, has a few bugs. Chief amongst which is as follows:
• When having multiple queries on the same panel. We are unable to select the options on multiple queries. For example, if we have queries A, B, and C , we select the option to include the sensor name on query A, then when we select the same option on query B, instead of enabling the option on query B, it turns off the same option on query A. The same happens if enabling the option on query C, it toggles the option on query A.
• When creating the data source, you can only select Save & Test once.Since if it is clicked again, it pops an error “Plugin health check failed” and within the logs, the following error is found:
o logger=context userId=1 orgId=1 uname=admin t=2025-06-11T10:52:53.1016838+02:00 level=error msg=“Request Completed” method=GET path=/api/datasources/uid/beoex0nj831tsa/health status=500 remote_addr=[::1] time_ms=4 duration=4.2999ms size=90 referer=http://localhost:3000/connections/datasources/edit/beoex0nj831tsa handler=/api/datasources/uid/:uid/health status_source=downstream errorReason=InternalError errorMessageID=plugin.healthCheck error=“client: failed to check health: rpc error: code = Unknown desc = panic triggered: duplicate metrics collector registration attempted”
When this is triggered, the plugin is restored by restarting the Grafana service. While this is nothing major, I thought that it was worth noting since other plugins don’t generally produce this kind of error.
Once again, thanks for your efforts, and if it helps, I can give you more information if requested.
Thank you again for your valuable feedback regarding the PRTG plugin. I wanted to let you know that the issues you reported have now been addressed.
✅ The bug related to toggling options across multiple queries in the same panel has been fixed.
To get the latest version with the fixes, please pull the updated branch:
Branch: grafana-prtg-datasource
Then rebuild the plugin as usual.
Additionally, please note:
You only need to register the plugin once via Grafana (e.g., at http://localhost:3000). After this, it will continue to work without requiring repeated registration.
If you encounter any further problems or need assistance with the update, feel free to reach out. I’m happy to help.
Thanks again for your support and feedback!
Best regards,
In my case it continues to show the error when you save the change to the data source, until you restart the Grafana service and it works again, but it shows data from 6 hours ago, not real-time data.
It’s a new installation that I performed a couple of hours ago with the latest version of Grafana 12.0.2.
Hi,
I just tested it again on my side and everything seems to be working fine now.
Please make sure to pull the latest version of the code and try again.
If the issue still persists, feel free to share more details so I can help you further.
Thanks!
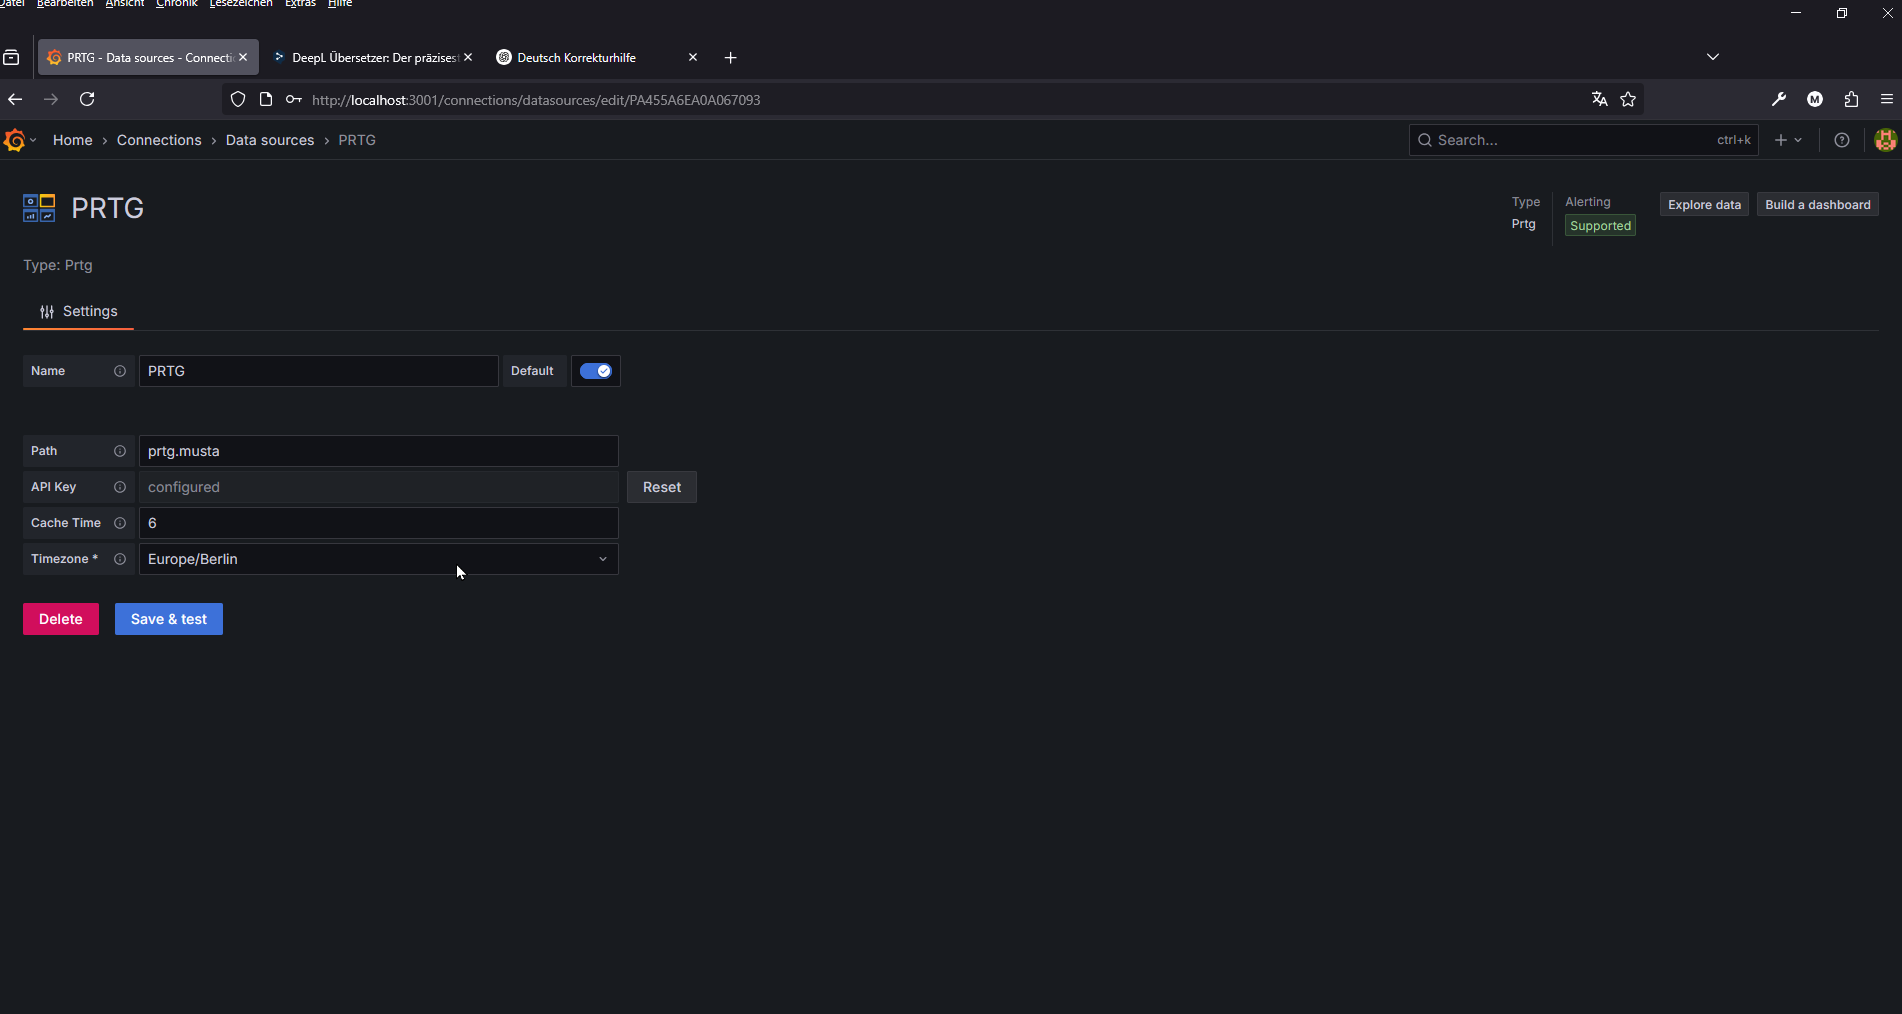
Have you selected the local time in ConfigEditor?
Hello
I tried applying the pull of the latest version, but I don’t know how to verify that it’s the latest version.
Regarding the time zone configuration, it’s configured the same way as the prtg server, but it still displays data from 5 hours ago.
Thank you for your help
Hello everyone,
I’m having trouble with the PRTG plugin. First of all thanks to the author it’s great!
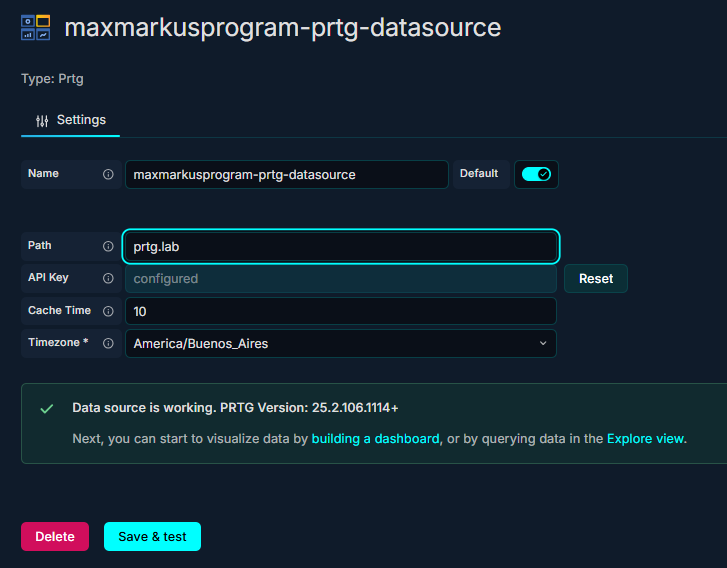
I proceeded to the complete installation, I have the plugin “maxmarkusprogram-prtg-datasource” in Grafana! And I’ve configured API key authentication, everything went correctly, I got a success message!
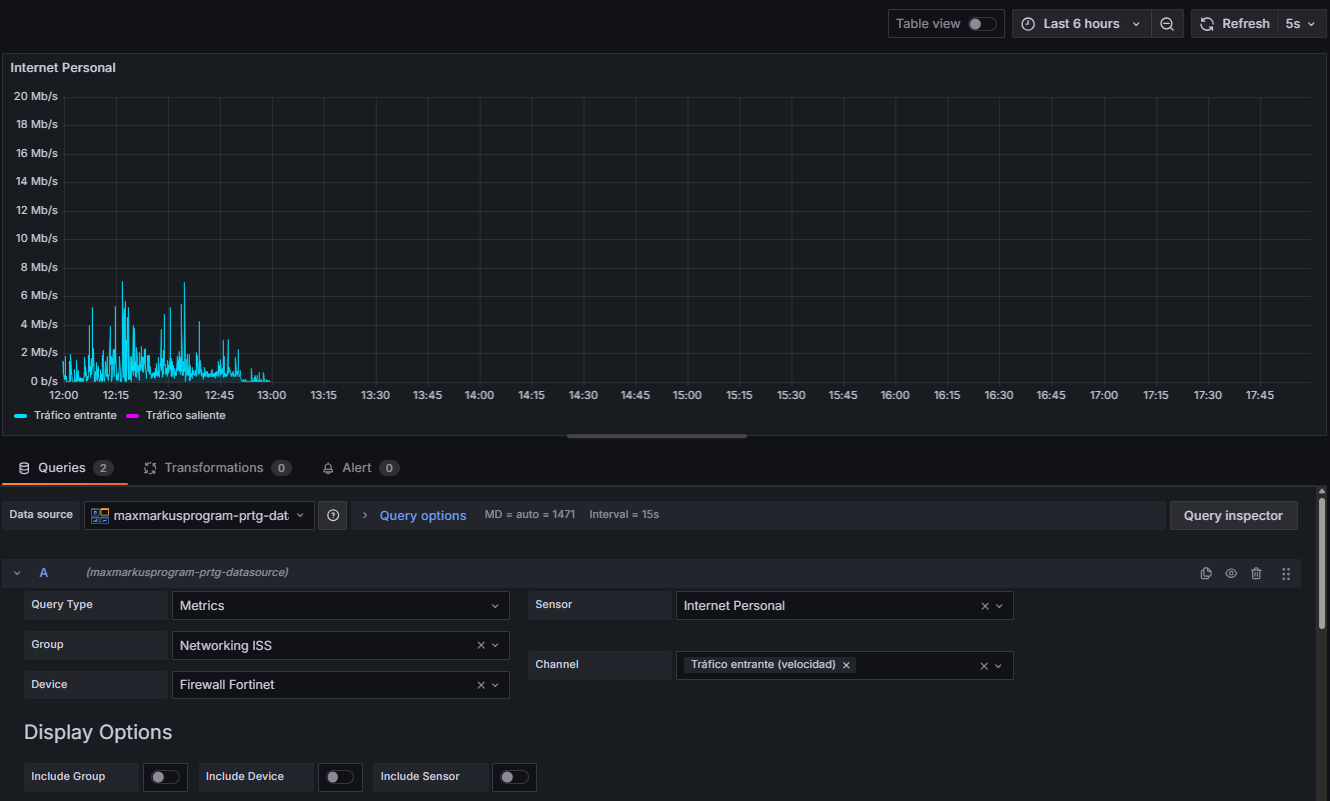
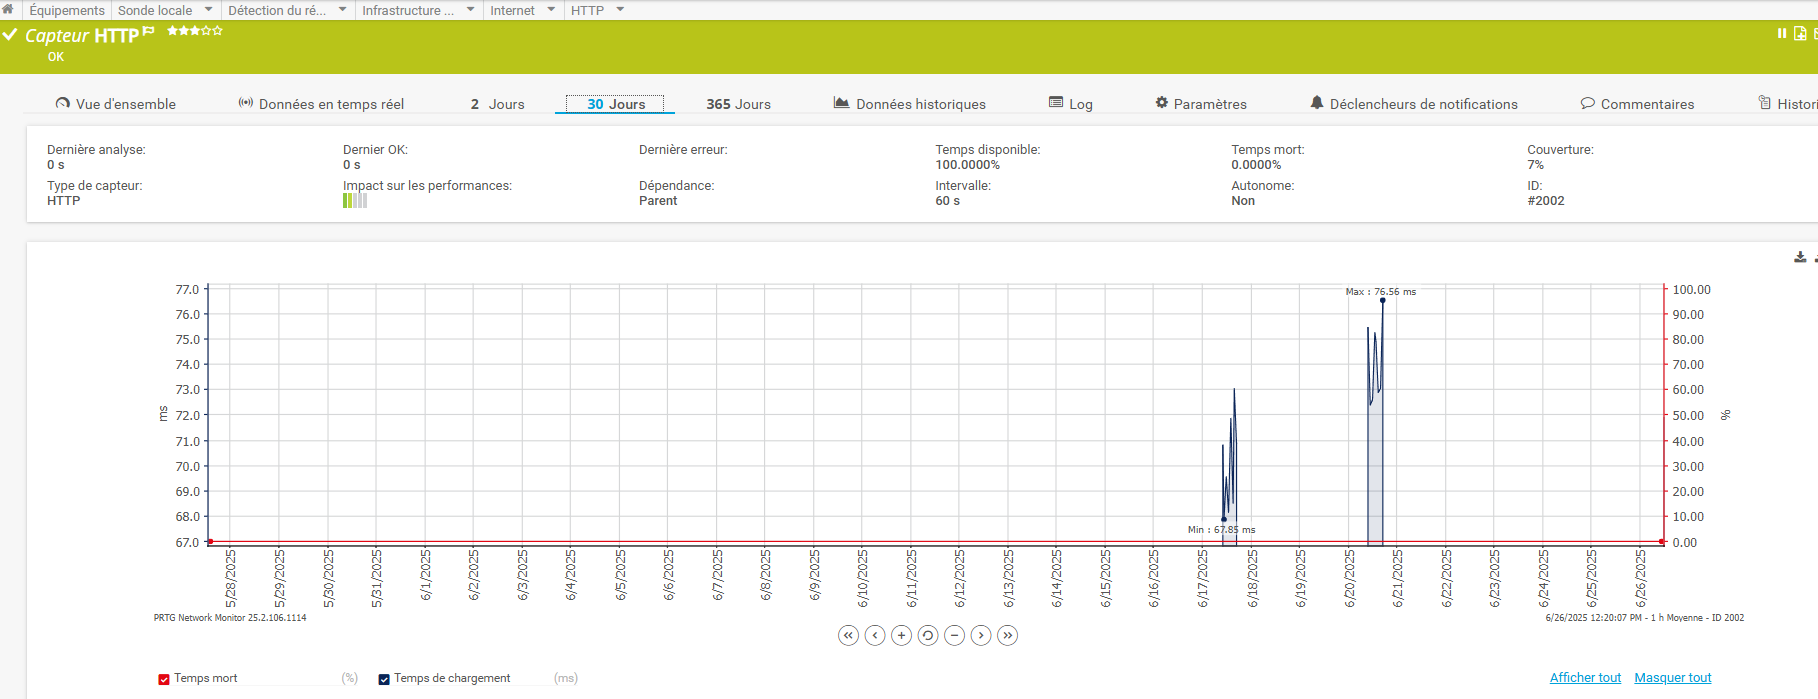
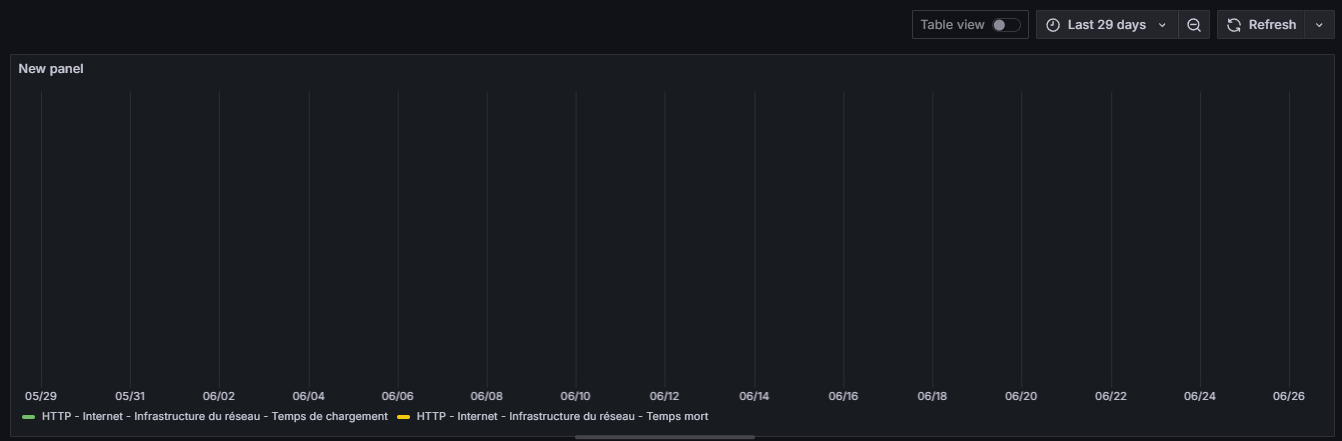
However, when I want to create a dashboard and enter parameters specific to my PRTG server (see images) I get no data.
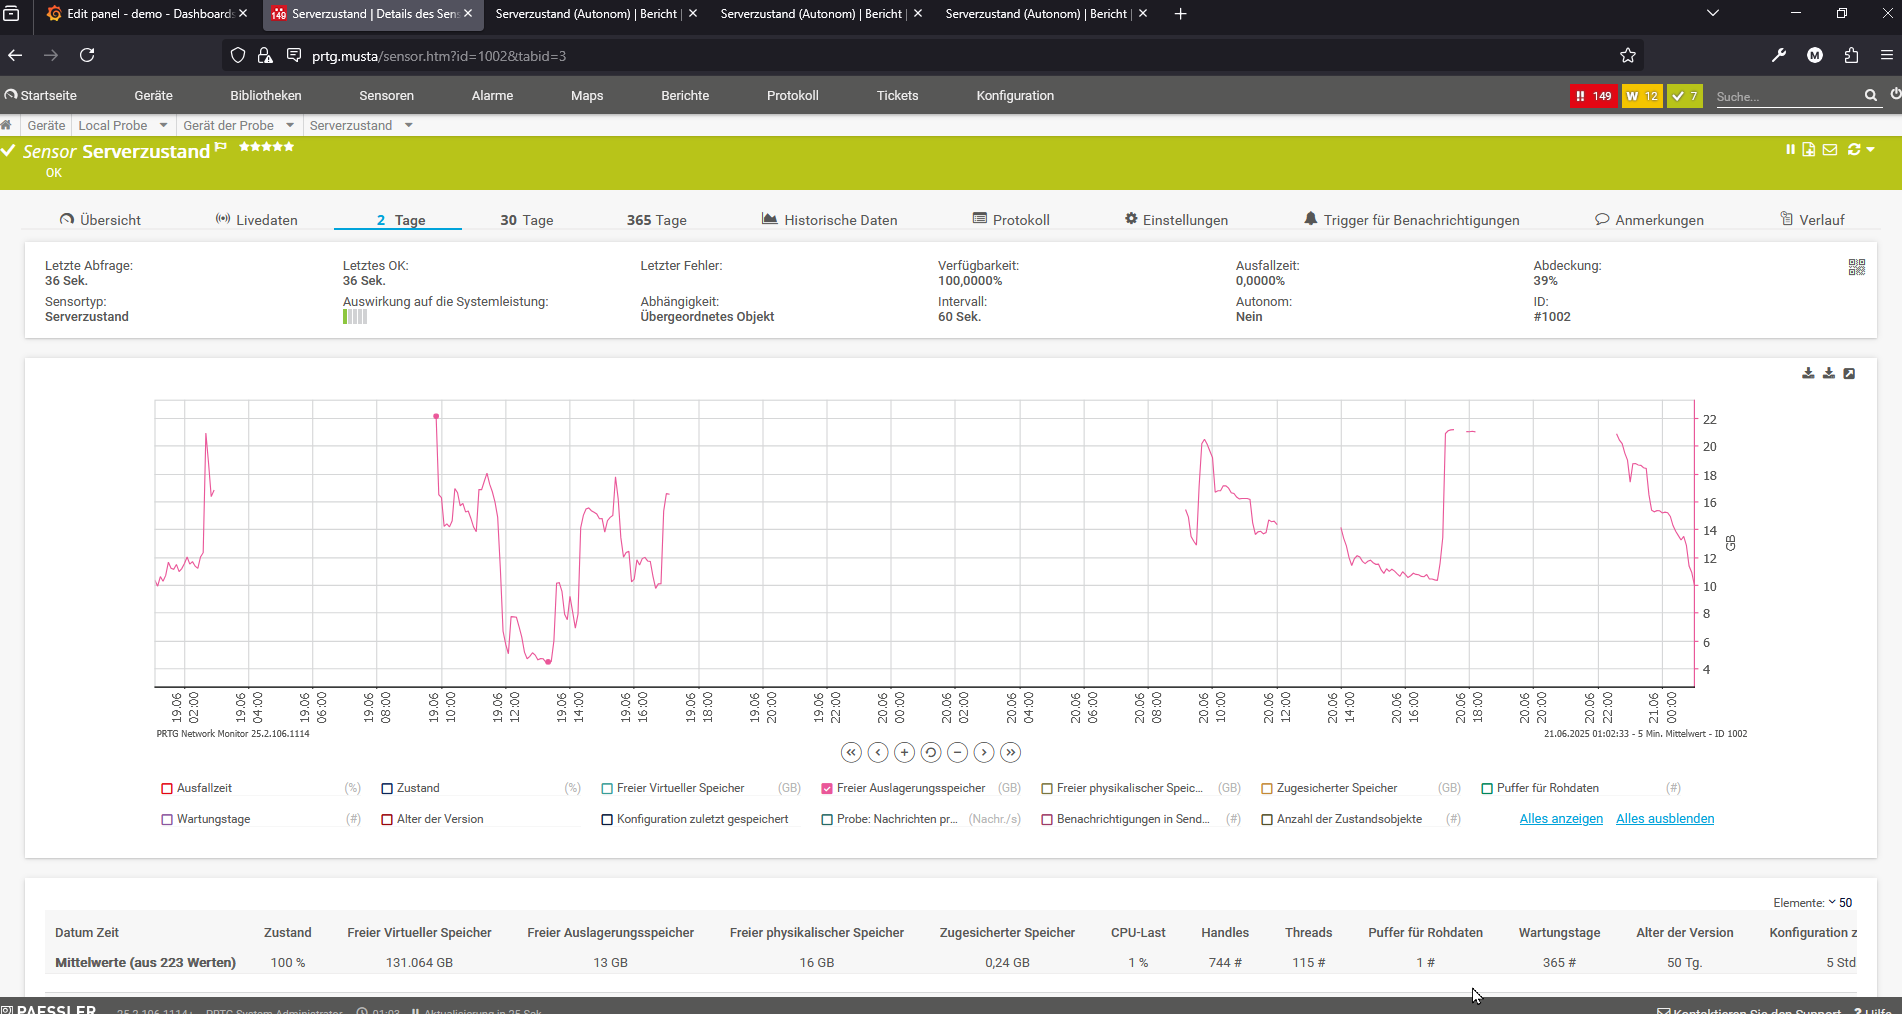
This is my PRTG device :
And here the dashboard configuration according to this previous device :
Any ideas?
Thank you for your help ! 
Hi, I know this problem please select the last 29 days and it will work I will fix this error when I have time. Thanks for the feedback
Hi @maxmarkusprogram,
Following your recommendation I put the last 29 days but nothing either. I investigated further, tried curl requests to my PRTG server, and got some data back.
I don’t quite understand how to do it.