hello,
I’m missing “contact points” and “notifications policies”
Seems that conf files from /var/lib/grafana/alerting also had been vanishes
The firt question is where this configuration settings are stored?
Could it be correlated with missing “contact points” and “notifications policies” ?
I copied the missing templates backup from /var/lib/grafana/alerting but it did not restore the missing configuration …
Marcin
Grafana’s transition from legacy alerting to the Unified Alerting platform represents a big step forward. But, there are many factors that can influence behavior, and it is often hard for the community to troubleshoot issues without a thorough understanding of your unique setup. Try to include the following info:
- What is your Grafana version?
- Are you using Grafana Cloud or self-hosted Grafana?
- Are you using legacy alerting or Unified Alerting?
- was the alert in question migrated from the legacy platform into Unified Alerting, or did you first create it inside the new platform?
- Please list ALL configuration options related to alerting. You can find these in the
Alerting and Unified Alerting sections of Grafana’s config file. If you are now using or have previously used the beta version of ngalert (released with Grafana 8), please note that too.
- you can use this table to better understand how configuration options can interact with each other
- If this is a templating issue on Unified Alerting, check if your alert is using a multi-dimensional rule or not.
- List the datasource associated with the alert
- Increase the verbosity of the Grafana server logs to
debug and note any errors. For printing to console, set the console logs to debug as well.
- Search for open issues on GitHub that sound similar to your problem
thx @anon70503803 I will try to prepere detailed input regarding this issue.
But could you give me a clue where is this configurations stored?
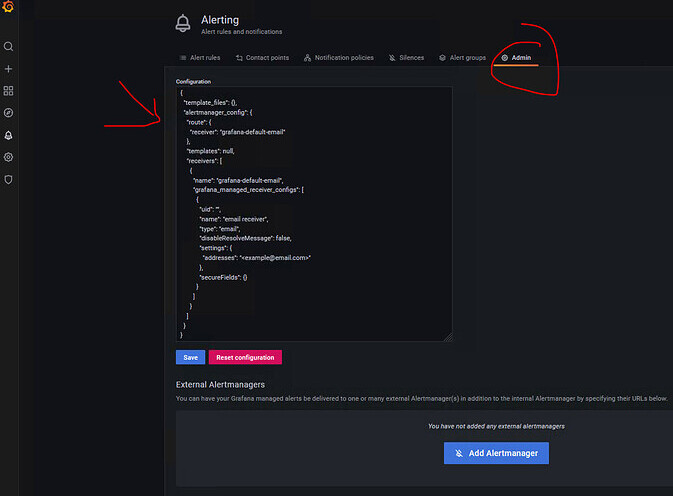
This “Admin” tab. In Grafana backend (im using sqlite) or in txt file (if yes what file)?
I wonder if someone has deleted it and this is the source of the problem.
Hi,
I am facing the same issue, both “contact points” and “notification policies” are gone since yesterday, and I don’t know why.
This has happened to me as well, actually three times over the last few months. I know - and still suspect - this is down to a misconfiguration on my part, however the correct configuration stays for many days - even weeks - before it suddenly disappears. Then I will have to re-enter the Contact Points, Notification policies and mute periods. I will submit an issue report (containing required level of details) about this when time allows.
Got exactly the same problem today.
I was able to fix it following the next steps, on an Ubuntu installation:
-
Stop grafana server
#> systemctl stop grafana-server.service
-
Make backups of the config database, to be safe
#> cd /var/lib/grafana
#> cp -a grafana.db grafana-bak.db
#> sqlite3 grafana.db ‘.clone grafana-dump.db’
-
Open the config database with sqlitebrowser o similar
#> sqlitebrowser grafana.db
-
On the “Browser Data” tab , open “alert configuration” table. Your old lost config should be there, but the last entry should be the default empty config, refering to “grafana-default-email”. If that is the case, delete that last entry of the table.
-
Save the modified database file from sqlitebrowser, and close sqlitebrowser
-
Start grafana, and lost config of contact points and policies should be back
#> systemctl start grafana-server.service
The problem should be fixed now.
Note: for some reason sometimes the access to the database is locked, and when it happens, the new alert system ngalert loads a default configuration and saves it at the database table “alert_configuration”. Next time ngalert access the database, it find the last entry of the table with the default config dont apply the former config entries.
Hope this helps!
This worked for me too, I am using Windows, OSS version 8.5.2.
Hello everyone.
I have recently had the same issue, so I posted on github about it.
Looks like some solution would be to edit grafana.ini regarding sqlite3 write ahead configuration.
Here’s the link to the issue on github:
Alerting: Contact points, custom templates, notification policies disappeared after alert rule editing · Issue #64798 · grafana/grafana (github.com)
Hope it helps!
(of course, don’t forget to keep regular backups)

