-
What Grafana version and what operating system are you using?
grafana v9.3.6 and Ubuntu 18.04.3 LTS
mysql server 8.0.25-15 -
What are you trying to achieve?
I installed grafana with Helm Charts to deploy Grafana in Kubernetes and used it to query mysql data. -
How are you trying to achieve it?
add data source of mysql and explore the mysql data in grafana dashboard -
What happened?
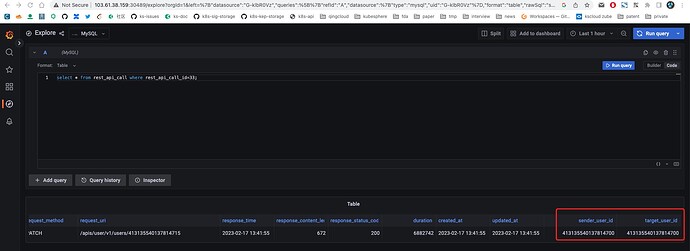
I can queried the mysql data, but some column’s data displayed on grafana dashboard does not match the database’s real data (mysqlclient is showing the real data). These columns are BIGINT types in mysql.
for example, please see the screenshots took for same record by mysql-client and grafana dashboard. Grafana showed wrong data for the column “sender_user_id” and “target_user_id” .
mysql-client
mysql> select * from rest_api_call where rest_api_call_id=33 \G
*************************** 1. row ***************************
       rest_api_call_id: 33
              source_ip: 192.168.0.2
             request_id: oHmdUAdm7EYfgch6tIzy
           request_time: 2023-02-17 05:41:55
         request_method: PATCH
            request_uri: /apis/user/v1/users/413135540137814715
          response_time: 2023-02-17 05:41:55
response_content_length: 672
   response_status_code: 200
               duration: 6882742
             created_at: 2023-02-17 05:41:55
             updated_at: 2023-02-17 05:41:55
         sender_user_id: 413135540137814715
         target_user_id: 413135540137814715
1 row in set (0.00 sec)
the description of mysql table:
mysql> desc rest_api_call;
+-------------------------+-----------------+------+-----+-------------------+-------------------+
| Field                   | Type            | Null | Key | Default           | Extra             |
+-------------------------+-----------------+------+-----+-------------------+-------------------+
| rest_api_call_id        | bigint unsigned | NO   | PRI | NULL              | auto_increment    |
| source_ip               | varchar(100)    | NO   |     | NULL              |                   |
| request_id              | varchar(100)    | NO   |     | NULL              |                   |
| request_time            | timestamp       | NO   |     | NULL              |                   |
| request_method          | varchar(20)     | NO   |     | NULL              |                   |
| request_uri             | varchar(500)    | NO   |     | NULL              |                   |
| response_time           | timestamp       | NO   |     | NULL              |                   |
| response_content_length | int             | NO   |     | NULL              |                   |
| response_status_code    | int             | NO   |     | NULL              |                   |
| duration                | bigint          | NO   |     | NULL              |                   |
| created_at              | timestamp       | NO   |     | CURRENT_TIMESTAMP | DEFAULT_GENERATED |
| updated_at              | timestamp       | NO   |     | CURRENT_TIMESTAMP | DEFAULT_GENERATED |
| sender_user_id          | bigint unsigned | NO   |     | NULL              |                   |
| target_user_id          | bigint unsigned | NO   |     | NULL              |                   |
+-------------------------+-----------------+------+-----+-------------------+-------------------+
14 rows in set (0.00 sec)
-
What did you expect to happen?
grafana shows same data as mysql client -
Can you copy/paste the configuration(s) that you are having problems with?
N/A -
Did you receive any errors in the Grafana UI or in related logs? If so, please tell us exactly what they were.
No error -
Did you follow any online instructions? If so, what is the URL?
No

