Grafana’s visual Canvas has been out for a little while now. But what can be done for IT when it comes to monitoring? In this first of three parts, we will explore the ability for a quick glance status dashboard for Level 1/NOC
Canvas has some basic shapes that can be easily implemented for most common uses. For IT, there are Single, Stack, Database and Terminal selections available. There is also a Metric Value element for pulling a field value on display and a text element. Using all three of these in conjunction gives the information I need to display my servers with the relevant information

This information can be pulled from any data source. In my case I needed something custom for our MySQL NDB stack. So my data source is MySQL

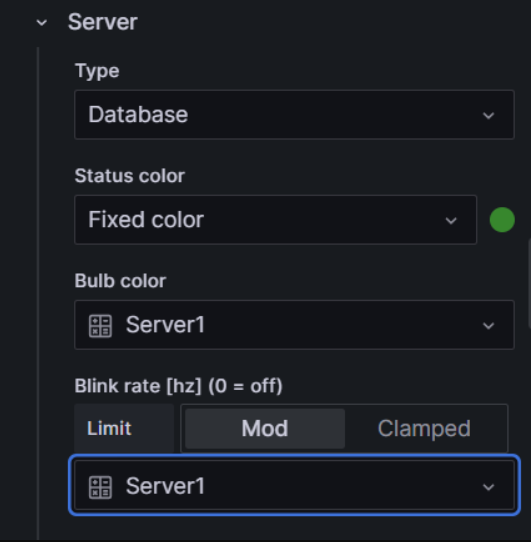
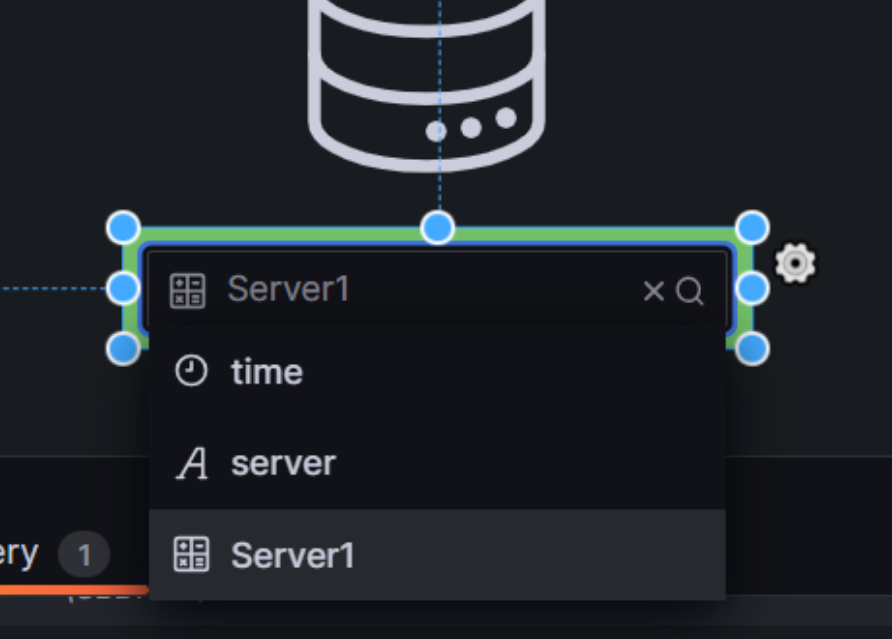
I can now tie my Server element to the value I want. I can also tie the bulb flash to the query field I want. In this case, whether or not the server is up
I can also tie my Metric Value to the value I want. This query was to determine if the ndb_mgm service was running on the server
I can now duplicate each element and map that element to a different value by adding an additional query with a different where clause
In the next part I will be mapping two locations and showing network saturation as it affects services such as database replication. Thanks for reading!