-
What Grafana version and what operating system are you using?
kube-prometheus-stack-70.7.0, grafana:11.6.0 -
What are you trying to achieve?
Send alert to jira -
How are you trying to achieve it?
Add the jira contact point on grafana UI
-
What happened?
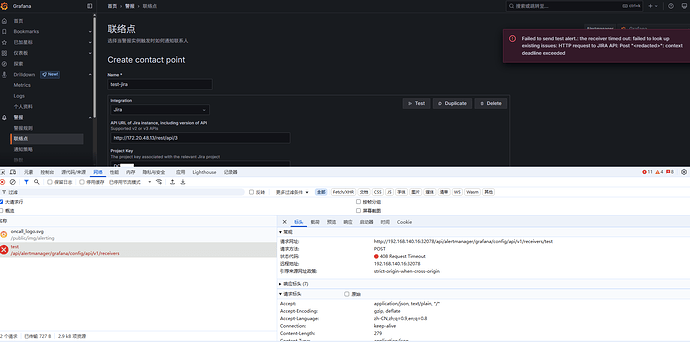
Timeout, connection failed -
What did you expect to happen?
Create the jira issue successfully. -
Can you copy/paste the configuration(s) that you are having problems with?
No configuration, just trying to add a rest url(http://172.20.48.13/rest/api/3) and test the connection. -
Did you receive any errors in the Grafana UI or in related logs? If so, please tell us exactly what they were.
yes, popuped an error message, please see the attached screenshot
-
Did you follow any online instructions? If so, what is the URL?
No
