Hello.
I am using Grafana 8.0.6 + InfluxDB.
Aleting to slack from Grafana.
Use multi-dimensional rule for notification.
To alerting in slack I see:
- alertname = Disk usage test
- env_test = core_test
- host = hostname.com
- path = /
Annotations:
Source: grafana.hostname.com
Silence:
Dashboard:
Panel:
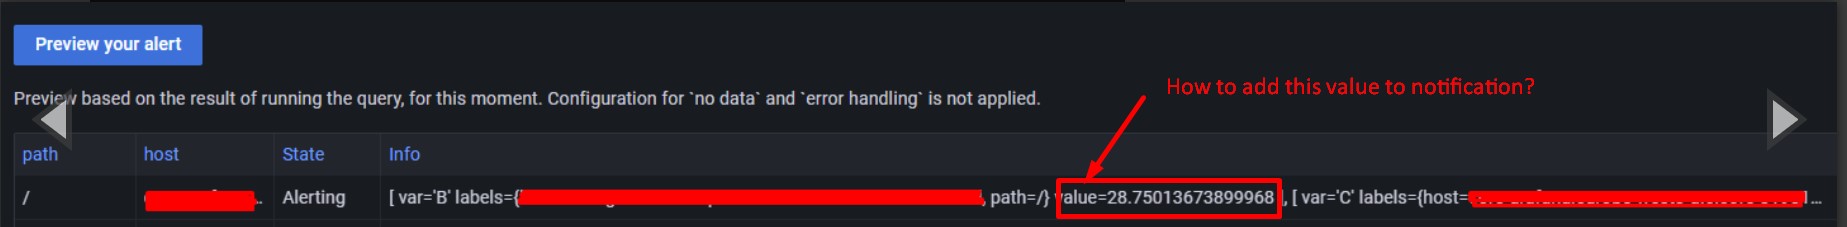
How to add currnet value to notification alert?
Preview alert:
Hey @mattabrams , this works for me. But the Value then is unsorted like this: (summary:)
How can you just print the metric and the value. Like the question here:
https://community.grafana.com/t/grafana-alerting-print-value/52650
I am having 5 queries and i tried all other combinations as well but nothing is printing.
@anon70503803
Thanks, its work for me.
@pratikdasbaghel1 @masterblaster are your alert rules using a classic condition or are they multi-dimensional? I believe this kind of templating is currently only possible with a multi-dimensional alert rule.
Hey, now i have figured it out. It shows that error but alerting still works. I get the alert notification even though that error keeps coming.