Hi,
Just installed Grafana 7.0 and using Elasticsearch 7.6.2.
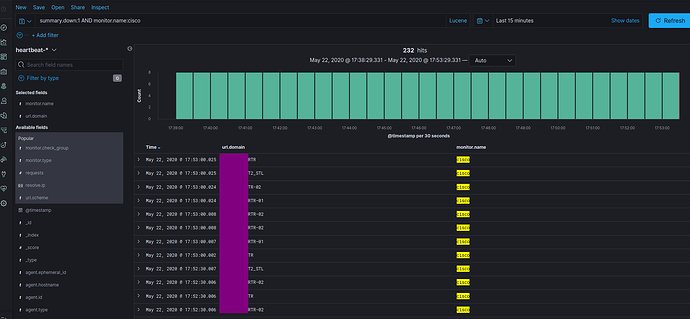
In the Kibana Discovery using query: summary.down:1 AND monitor.name:cisco, I have the right result, as follow:
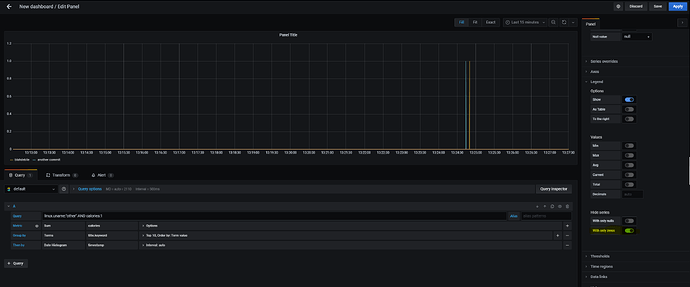
Then I use the query in grafana, I got server that not in the query result in Kibana as follow:
Already check the result in kibana, no IP 10.x.x.x, but in Grafana still display.
It’s weird, I have same result when I use the Grafana 6.7.3…
Is it bug?
Regards,
Fadjar Tandabawana
You can hide these ‘unrelated results’ by switching the “With only zeros” toggle in the “Legend” section of the plugin.
Dear @faolan0, yes I can hide it, but when I use Stat Panel, the result is the same.
It’s not expected result as I use with Grafana 6.x version, It shouldn’t include the unrelated result instead.
BTW, thank you for the hint… I just need to use Stat panel for better visualization of the Down state of the target.
Regards,
Fadjar Tandabawana
When I copy the old Stat from other dashboard and change the query, the result is right and as my expectation.
I think the script to make the json file in the v7.0 need to improve…
Thanks…


