Getting value derivative

Hi,

I am recreating a dashboard due to data source shift from InfluxDB to Elasticsearch.
For system statistics (context switch, network usage etc), we created graphs displaying the rate of change in value over time using derivative. for example:

SELECT non_negative_derivative(mean(bytes_recv),1s)*8 as "in"  
FROM "net" 
WHERE 
    host =~ /$server/ AND interface =~ /(vlan|eth|bond|vmbr|ens).*/ 
    AND interface !~ /veth/ 
    AND $timeFilter
GROUP BY time($interval), * fill(none)

How do I implement it with Elasticsearch?

Thanks

How far did you get and what part was hard to translate to elasticsearch? Is it the non_negative_derivative function?

This is what I did so far:
Query definition: $server, Metrics: Average(private_data.systemMetrics.systemData.net.packets_recv), Group by: Date Histogram(private_data.timestamp), Alias: packets received {{metric}}
The query sent to Elasticsearch

request:Object
method:"POST"
url:"api/datasources/proxy/1/_msearch"
data:"{"search_type":"query_then_fetch","ignore_unavailable":true,"index":"beaconindex"} {"size":0,"query":{"bool":{"filter":[{"range":{"private_data.timestamp":{"gte":"1511859284289","lte":"1511862884289","format":"epoch_millis"}}},{"query_string":{"analyze_wildcard":true,"query":"lilach\\-centos\\-vm.com"}}]}},"aggs":{"2":{"date_histogram":{"interval":"2m","field":"private_data.timestamp","min_doc_count":0,"extended_bounds":{"min":"1511859284289","max":"1511862884289"},"format":"epoch_millis"},"aggs":{"1":{"avg":{"field":"private_data.systemMetrics.systemData.net.packets_recv"}}}}}} {"search_type":"query_then_fetch","ignore_unavailable":true,"index":"beaconindex"} {"size":0,"query":{"bool":{"filter":[{"range":{"private_data.timestamp":{"gte":"1511859284289","lte":"1511862884289","format":"epoch_millis"}}},{"query_string":{"analyze_wildcard":true,"query":"lilach\\-centos\\-vm.com"}}]}},"aggs":{"2":{"date_histogram":{"interval":"2m","field":"private_data.timestamp","min_doc_count":0,"extended_bounds":{"min":"1511859284289","max":"1511862884289"},"format":"epoch_millis"},"aggs":{"1":{"avg":{"field":"private_data.systemMetrics.systemData.net.packets_sent"}}}}}} "![30|690x363](upload://sxbFHDItKKWBbxDYcRIcYFb62GX.png)

The hard part is how to define the non_negative_derivative on required metric using the query UI.
I am working with Grafana v4.5.2.
When I choose Derivative metrics it doesn’t let me choose metric, neither typing it works.
In addition I would like to define sub terms as in above influxDB query: (vlan|eth|bond|vmbr|ens)
to get separate aggregations of bytes_recv, per network interface type. I prefer not to define separate queries neither to define and use “interface” template param.

I think I found how to use derivative. Here is what I’ve done:

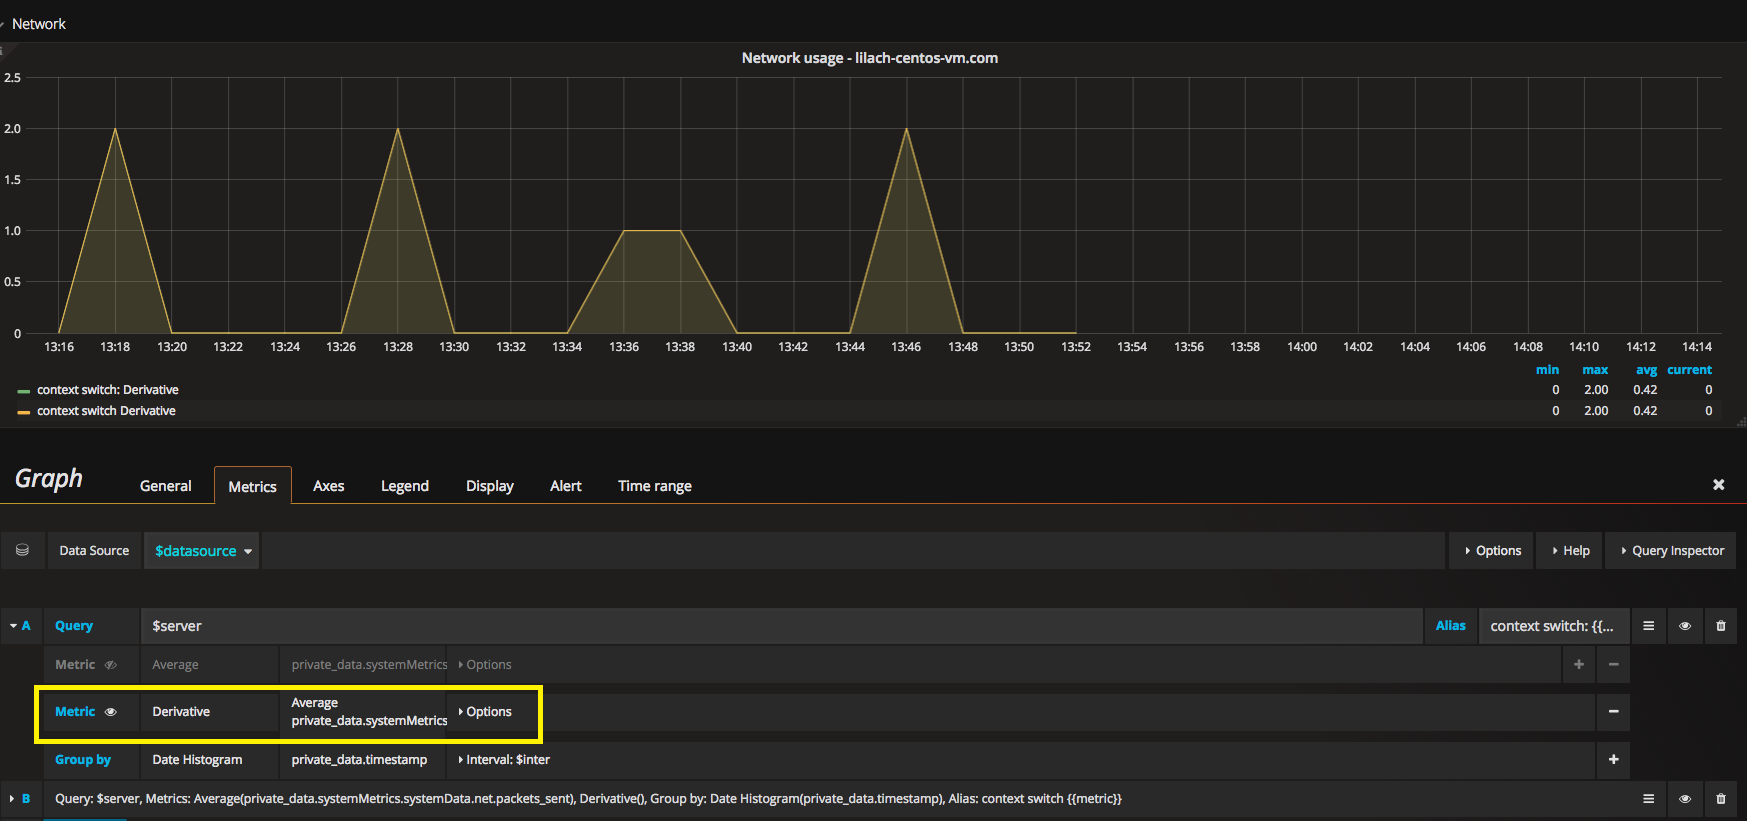
The way to add Derivative, was to add to the query another metric, that is Derivative. To add the value on which it applies was easy when I started by the value metric: Average [metric name]

In my case (there is an auto complete for the metric name):
Average private_data.systemMetrics.systemData.net.packets_recv
then I got the derivative graph and could hide the value graph.
See the image.

The query looks like this (Lucene):
Query (total received and sent packets queries):
A
Query: $server, Metrics: Average(private_data.systemMetrics.systemData.net.packets_recv), Derivative(), Group by: Date Histogram(private_data.timestamp), Alias: context switch: {{metric}}
B
Query: $server, Metrics: Average(private_data.systemMetrics.systemData.net.packets_sent), Derivative(), Group by: Date Histogram(private_data.timestamp), Alias: context switch {{metric}}
Elasticsearch query:
request:Object
method:“POST”
url:“api/datasources/proxy/1/_msearch”
data:"{“search_type”:“query_then_fetch”,“ignore_unavailable”:true,“index”:“beaconindex”} {“size”:0,“query”:{“bool”:{“filter”:[{“range”:{“private_data.timestamp”:{“gte”:“1511868117482”,“lte”:“1511871717482”,“format”:“epoch_millis”}}},{“query_string”:{“analyze_wildcard”:true,“query”:“lilach\-centos\-vm.com”}}]}},“aggs”:{“2”:{“date_histogram”:{“interval”:“2m”,“field”:“private_data.timestamp”,“min_doc_count”:0,“extended_bounds”:{“min”:“1511868117482”,“max”:“1511871717482”},“format”:“epoch_millis”},“aggs”:{“1”:{“avg”:{“field”:“private_data.systemMetrics.systemData.net.packets_recv”}},“3”:{“derivative”:{“buckets_path”:“1”}}}}}} {“search_type”:“query_then_fetch”,“ignore_unavailable”:true,“index”:“beaconindex”} {“size”:0,“query”:{“bool”:{“filter”:[{“range”:{“private_data.timestamp”:{“gte”:“1511868117482”,“lte”:“1511871717482”,“format”:“epoch_millis”}}},{“query_string”:{“analyze_wildcard”:true,“query”:“lilach\-centos\-vm.com”}}]}},“aggs”:{“2”:{“date_histogram”:{“interval”:“2m”,“field”:“private_data.timestamp”,“min_doc_count”:0,“extended_bounds”:{“min”:“1511868117482”,“max”:“1511871717482”},“format”:“epoch_millis”},“aggs”:{“1”:{“avg”:{“field”:“private_data.systemMetrics.systemData.net.packets_sent”}},“3”:{“derivative”:{“buckets_path”:“1”}}}}}} "

1 Like

thank you very much. It’s just what I needed