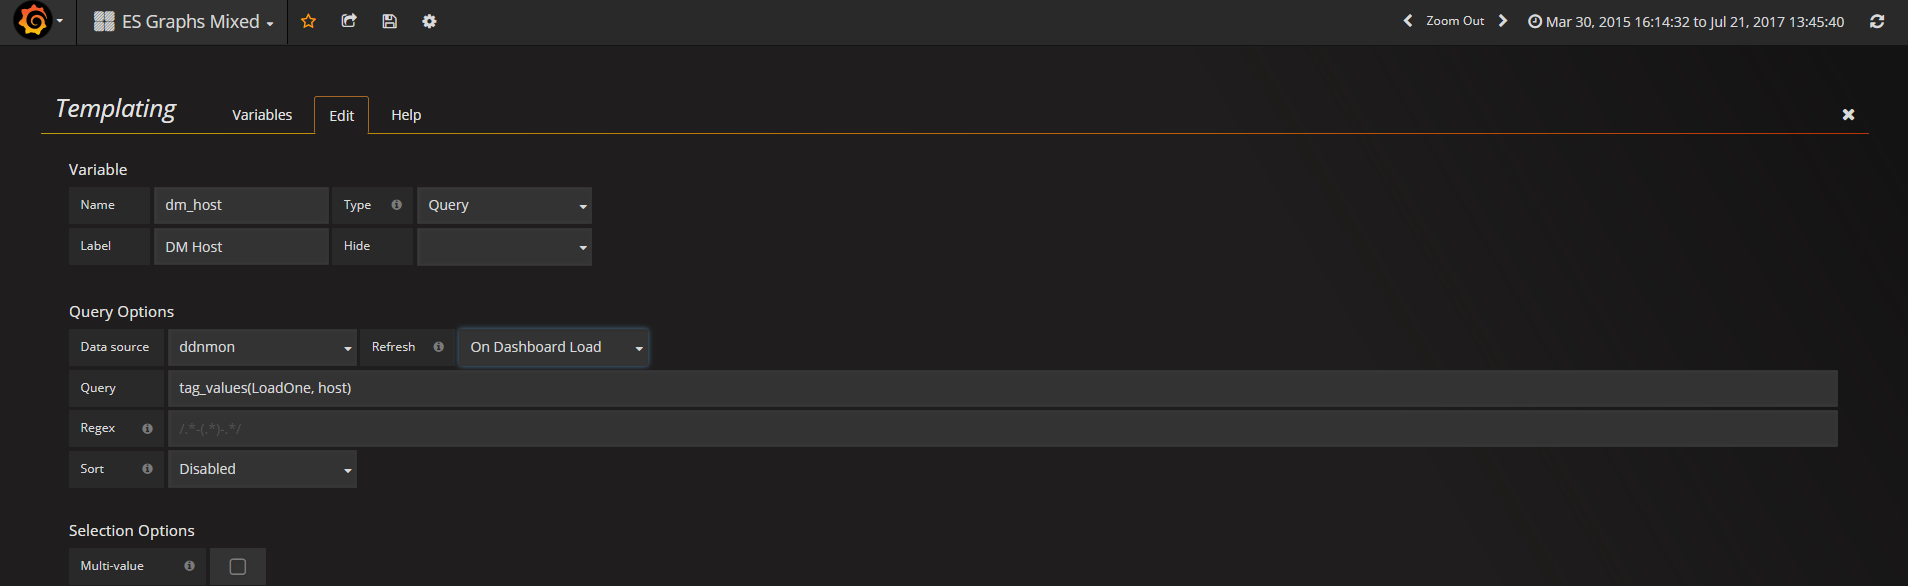
While adding a new variable in template whenever I choose “On dashboard load” option in Refresh section for more than two variable in a single dashboard then it gives the error “Getting grafana templating init failed [object object]”.
I am using Grafana version 4.3.2 and KairosDb as data source.
Also after refreshing the dashboard one of the variables doesn’t show any values.
If I don’t choose “On dashboard load” for more than two variables then it works fine.
KairosDB gives the values but after refreshing the dashboard it disappears.
If I select “Never” instead of “On dashboard load” in the Refresh section then it works fine.
Problem occurs only if i select “On dashboard load” for more than two variables otherwise it works.
@ankitpareek sorry, forgot about this when I went on vacation. [Object Object] as the error message is a bug in the error reporting of the Kairos DB data source. Did you figure out the problem?
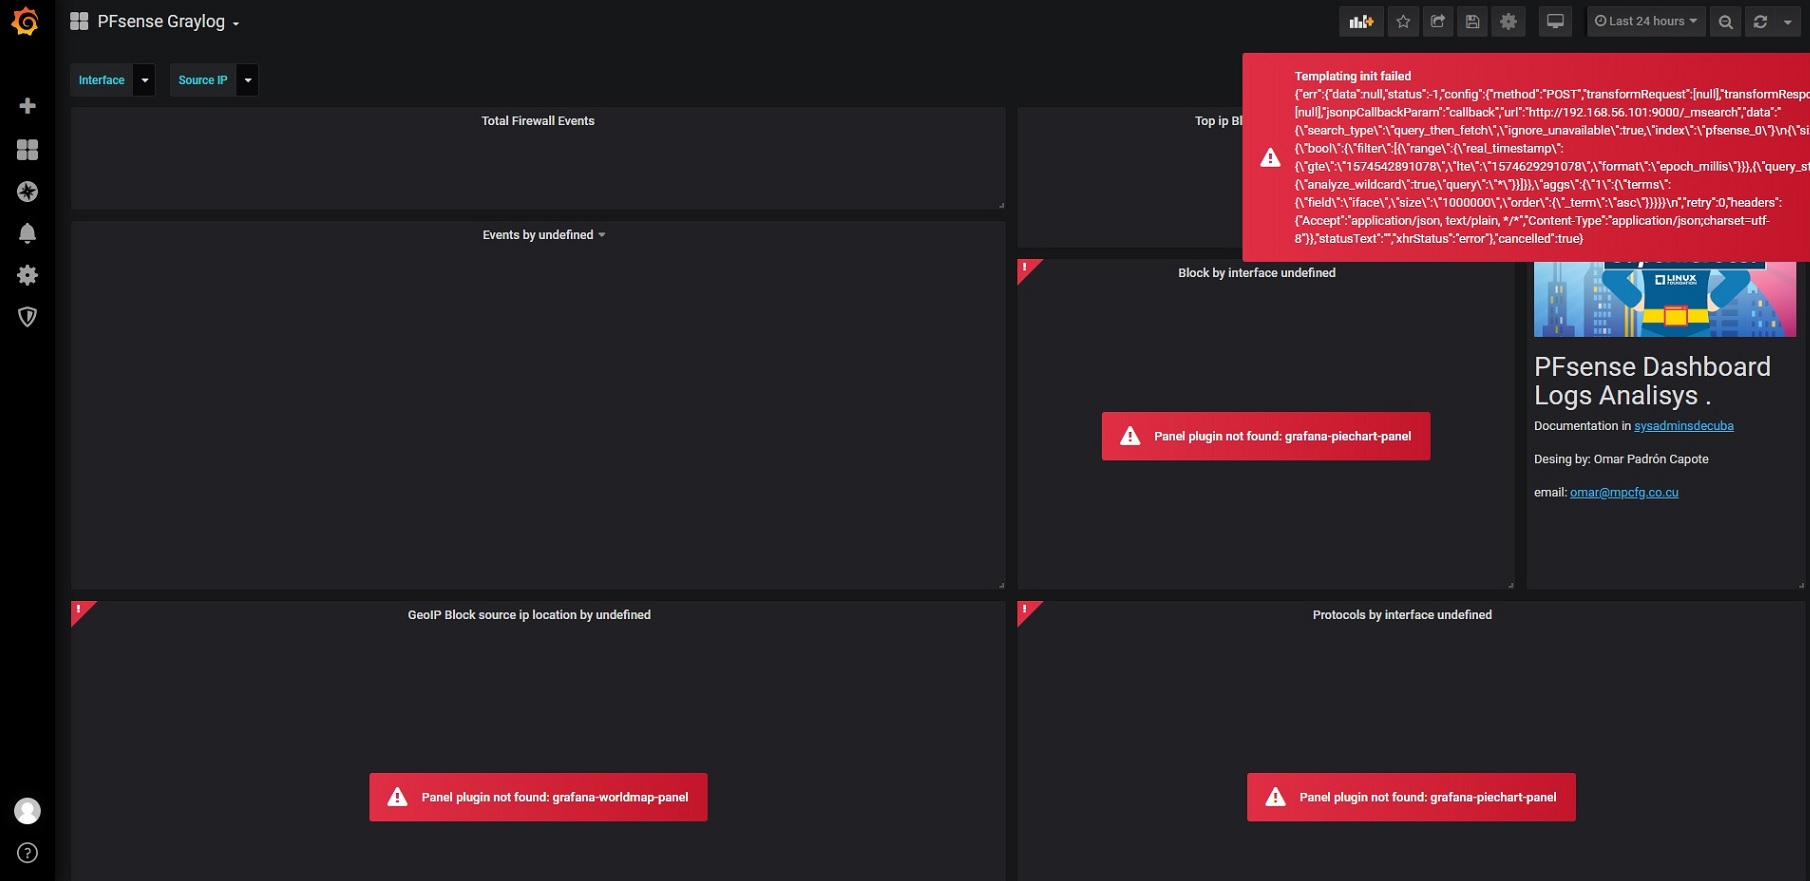
@murryy79 That’s not the same error. In your case, it is easy to see what the error is. Grafana cannot reach the server: “502 (Bad Gateway)”. Maybe it is a DNS or firewall problem?
1、The grafana I used is grafana-6.4.0-1.x86_64.rpm;
2、The Prometheus I used is “prometheus-2.0.0.linux-amd64”;
3、The node_exporter I used is “node_exporter-0.18.1.linux-amd64”;
4、The Dashboards template I use is “Node Exporter v0.16–0.18” and its ID is: 10262
But what I see on the granfana interface is "Templating init failed Cannot read property ‘result’ of undefined"