Hi There,
I’m very new to grafana and am struggling to get my graph to show anything. I can get the table to show the values. So data source connection seems ok. I believe the issue with graphing is the Timestamp column (or its formatting)
I’m pulling data from my solar panels stored in a sqlite database using this script and have installed the SQLite datasource plugin and can see the data from my sqlite db.
From sqllite
sample of the data (only the two colums I’m after)
sqlite> select Timestamp,P_PV from site LIMIT 2;
2021-09-18T11:47:02+10:00|1384
2021-09-18T11:47:02+10:00|1384
Grafana Queries
After reading these articles this I tried a number of grafana queries where I convert the Timestamp column to datetime format but no luck. In all of these the column (in table view looks to be time format)
WITH CONVERTED AS
(SELECT P_PV, STRFTIME('%Y-%m-%dT%H:%M:%SZ', Timestamp) AS Time FROM site)

SELECT Time, P_PV FROM CONVERTED ORDER BY Time ASC
I’m almost certain that this be because of the way that my Timestamp column is being read by grafana as not being a timesource.
In table view the times are showing as follows format:
2021-09-18 11:47:02
2021-09-18 11:47:02
2021-09-18 11:47:07
I’ve also tried by just having unixtimestamp eg (1631937866) as the time field and still cannot get the graph to show.
Hope this makes sense to people, and I hope it’s something simple that people can help with.
Many thanks
Lucy
Hi Lucy,
Weirdly I was just talking with someone else about formatting of dates in his charts and he was able to achieve this by adjusting the Grafana server-wide settings, outlined in this blog post:
Hopefully this will help you get the format you need.
If you need to do this on a specific dashboard / query, then I’m not sure on how best to achieve this.
Good luck,
Simon
Hi Simon,
Thanks for that link - it looks interesting, I now think my issue is more related to the actual query in grafana.
I’ve tweaked the query to return the date in a RFC3339 format (eg: “2006-01-02T15:04:05Z07:00”) which I believe is the required format for the sqlite plugin.
My Query now is:
WITH converted AS (
SELECT E_Day, REPLACE(Timestamp, '+','Z') AS datetime FROM site WHERE Timestamp
)
SELECT datetime, E_Day FROM converted ORDER BY datetime ASC
Now the issue I have is nothing is shown on the graph - with an error: “Invalid Date:”
Anyone have any pointers or suggestions?
Hi Lucy,
I am wondering whether your query text may have got cut off…? The WHERE clause does not seem to be complete for the definition for “converted”. Also, I am wondering whether the use of the keyword / datatype “datetime” may be problematic? The only other thing I can suggest is placing a CAST or CONVERT around the REPLACE(Timestamp, ‘+’,‘Z’), as it would currently be returning a string, I would expect, and if Grafana is expecting a date, that could be throwing it off…
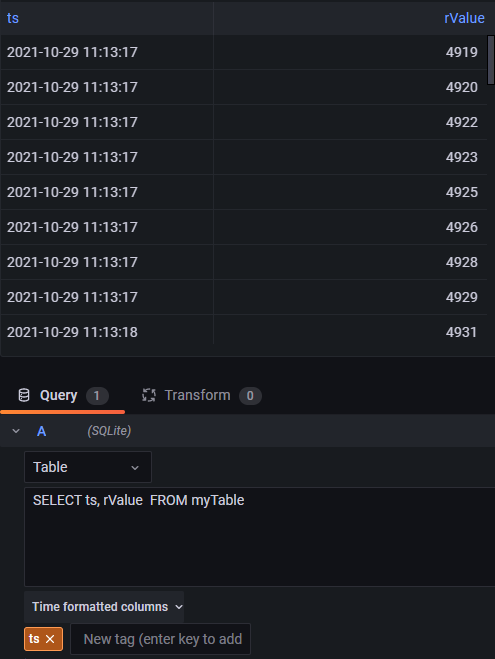
Hi everyone! I have the same struggle right now. I have just simple test table with timestamp and value. So, my timestamp is in epoch unix format, as you can see:

I use same SQLite plugin, and data source connection is ok, i test it on two different machines with windows and linux.
Plugin should allow me convert timestamp automatically, as it is in unix format and i can see that this is true, because when i switch to the table view, i get correct results:
But I can’t get “Time series” graph, there is no any data points, and i don’t understand what is the issue, everything seems correct to me.
I’ve just started working with Grafana, so any help is appreciated.
Many Thanks, Daniil