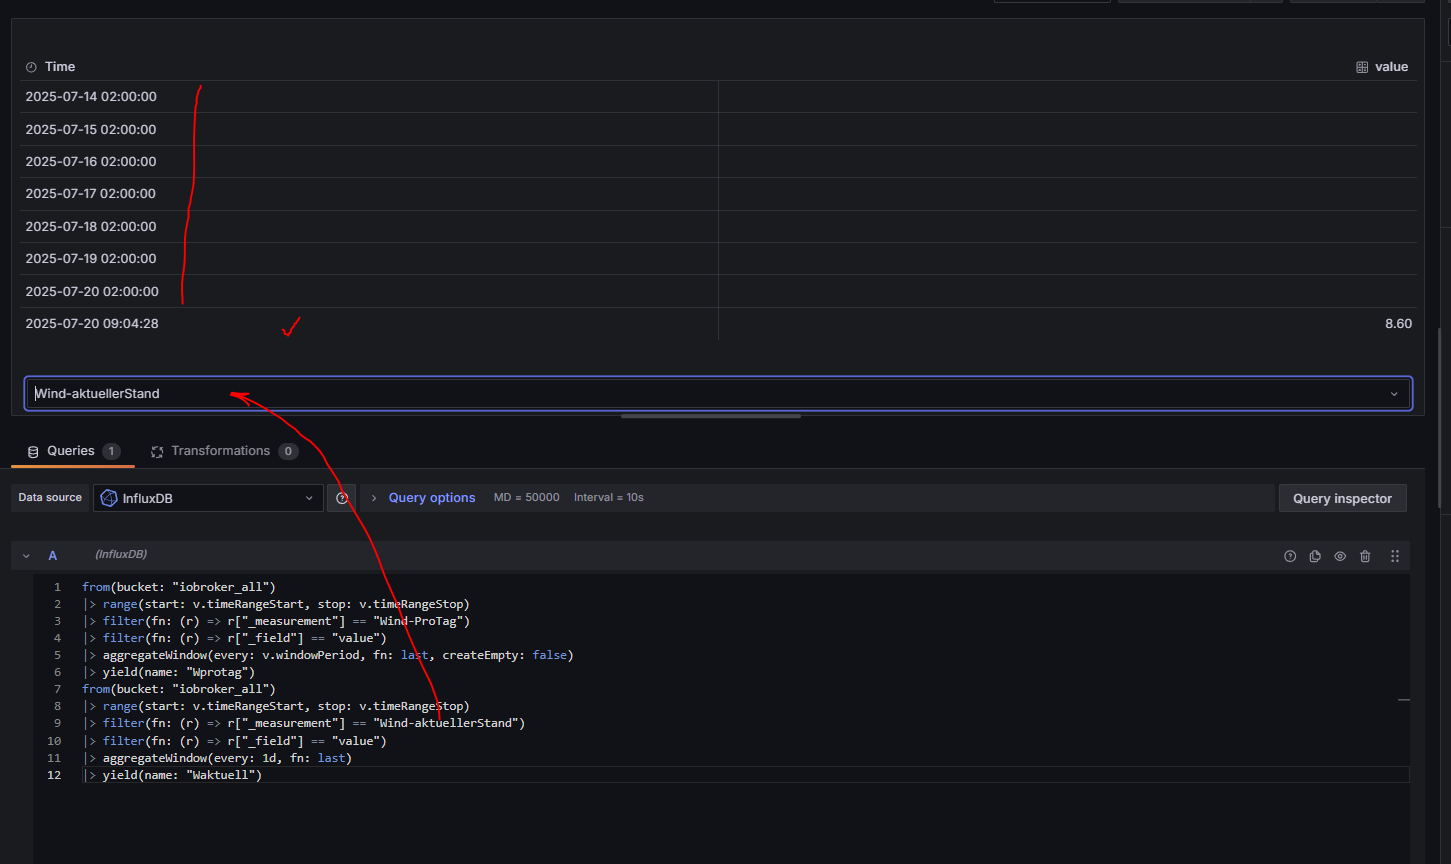
The values for the current day are stored in a separate measurement, “Wind-currentDay.” However, I only need the last and current value for display purposes.
The query without the daily value looks like this:
from(bucket: "iobroker_all")
|> range(start: v.timeRangeStart, stop: v.timeRangeStop)
|> filter(fn: (r) => r["_measurement"] == "Wind-PerDay")
|> filter(fn: (r) => r["_field"] == "value")
|> aggregateWindow(every: 1d, fn: last, timeSrc:"_start")  // displays the last value each day from the Wind-PerDay measurement
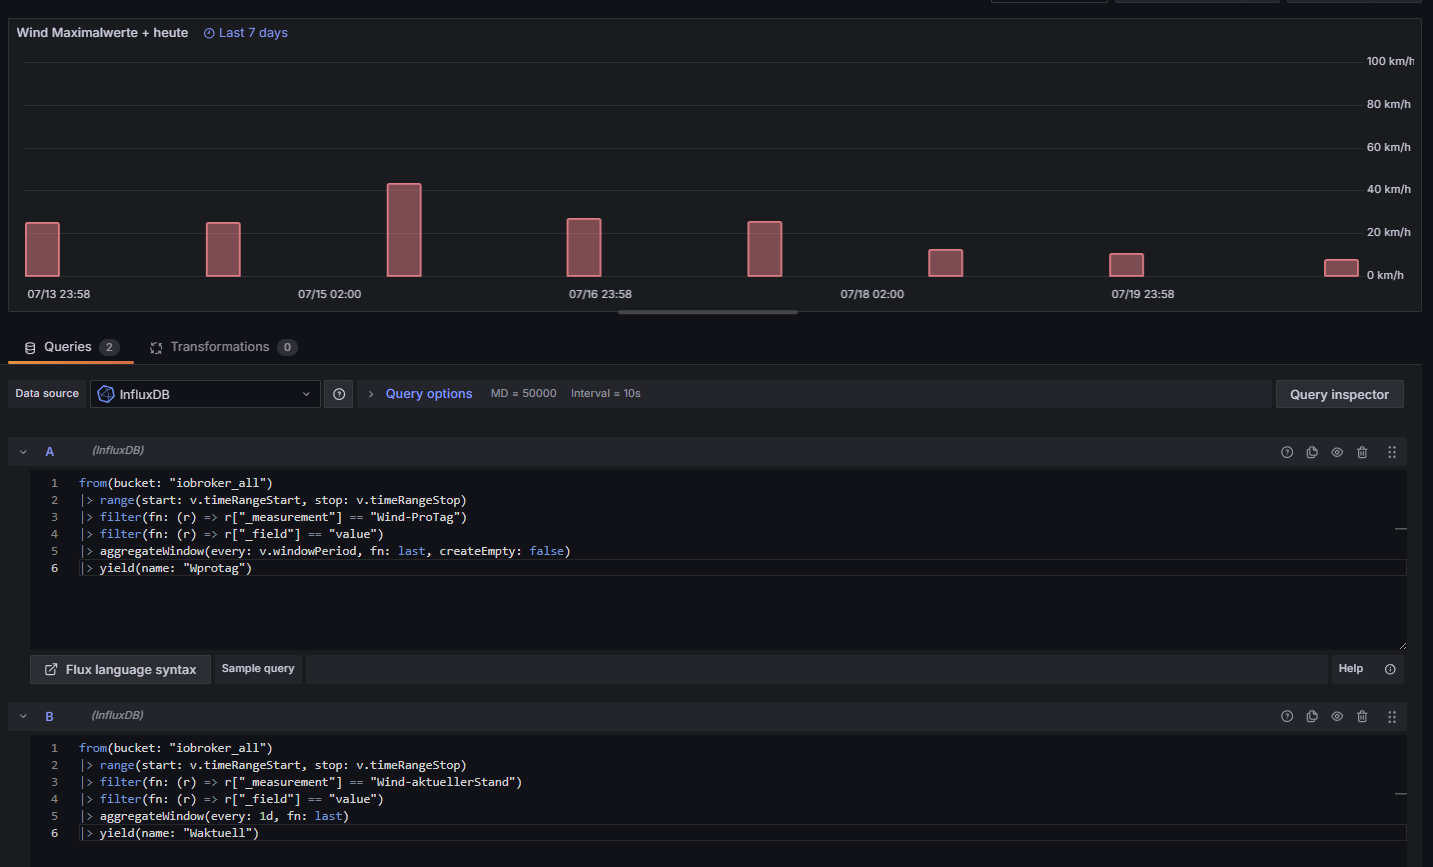
For the current value, call this Query B:
from(bucket: "iobroker_all")
|> range(start: v.timeRangeStart, stop: v.timeRangeStop)
|> filter(fn: (r) => r["_measurement"] == "Wind-currentDay")
|> filter(fn: (r) => r["_field"] == "value")
|> aggregateWindow(every: 1d, fn: last, timeSrc:"_start")  // displays the last 'current' value each day from the Wind-currentDay measurement
Create both Query A and B in Grafana so they are both displayed.
Hello,
I’m still testing, but your tip has already helped me a lot.
Background to the problem:
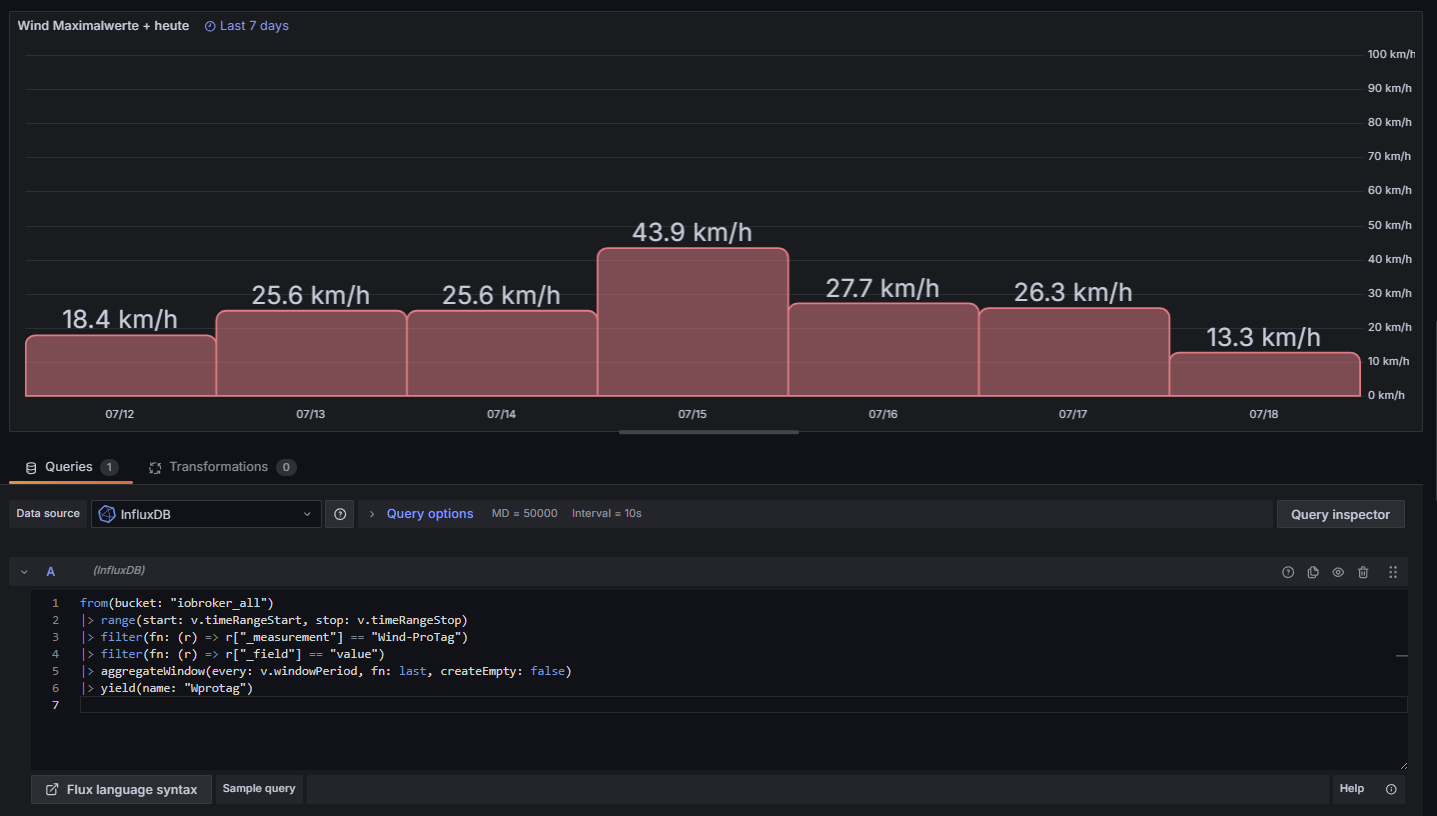
I want to display the maximum values of the wind measurements (past days and current day) in Grafana (bar chart).
For this purpose, I have two measurements with data.
The first measurement contains the maximum values of the respective day (1 value per day) for each day (time: 11:58 PM).
In addition, I record the values of the current day (multiple values) in a second measurement. Here, a new value is always written whenever the value is higher than the last recorded value. At the end of the day, the last recorded value, which must be the highest of the current day, is transferred to the first measurement.
I then delete the second measurement (daily measurement) using “influx delete.” This way, current values can be saved for the next day.
In the latest version, I first removed this line from the first query:
|> aggregateWindow(every: 1d, fn: last, timeSrc:“_start”)
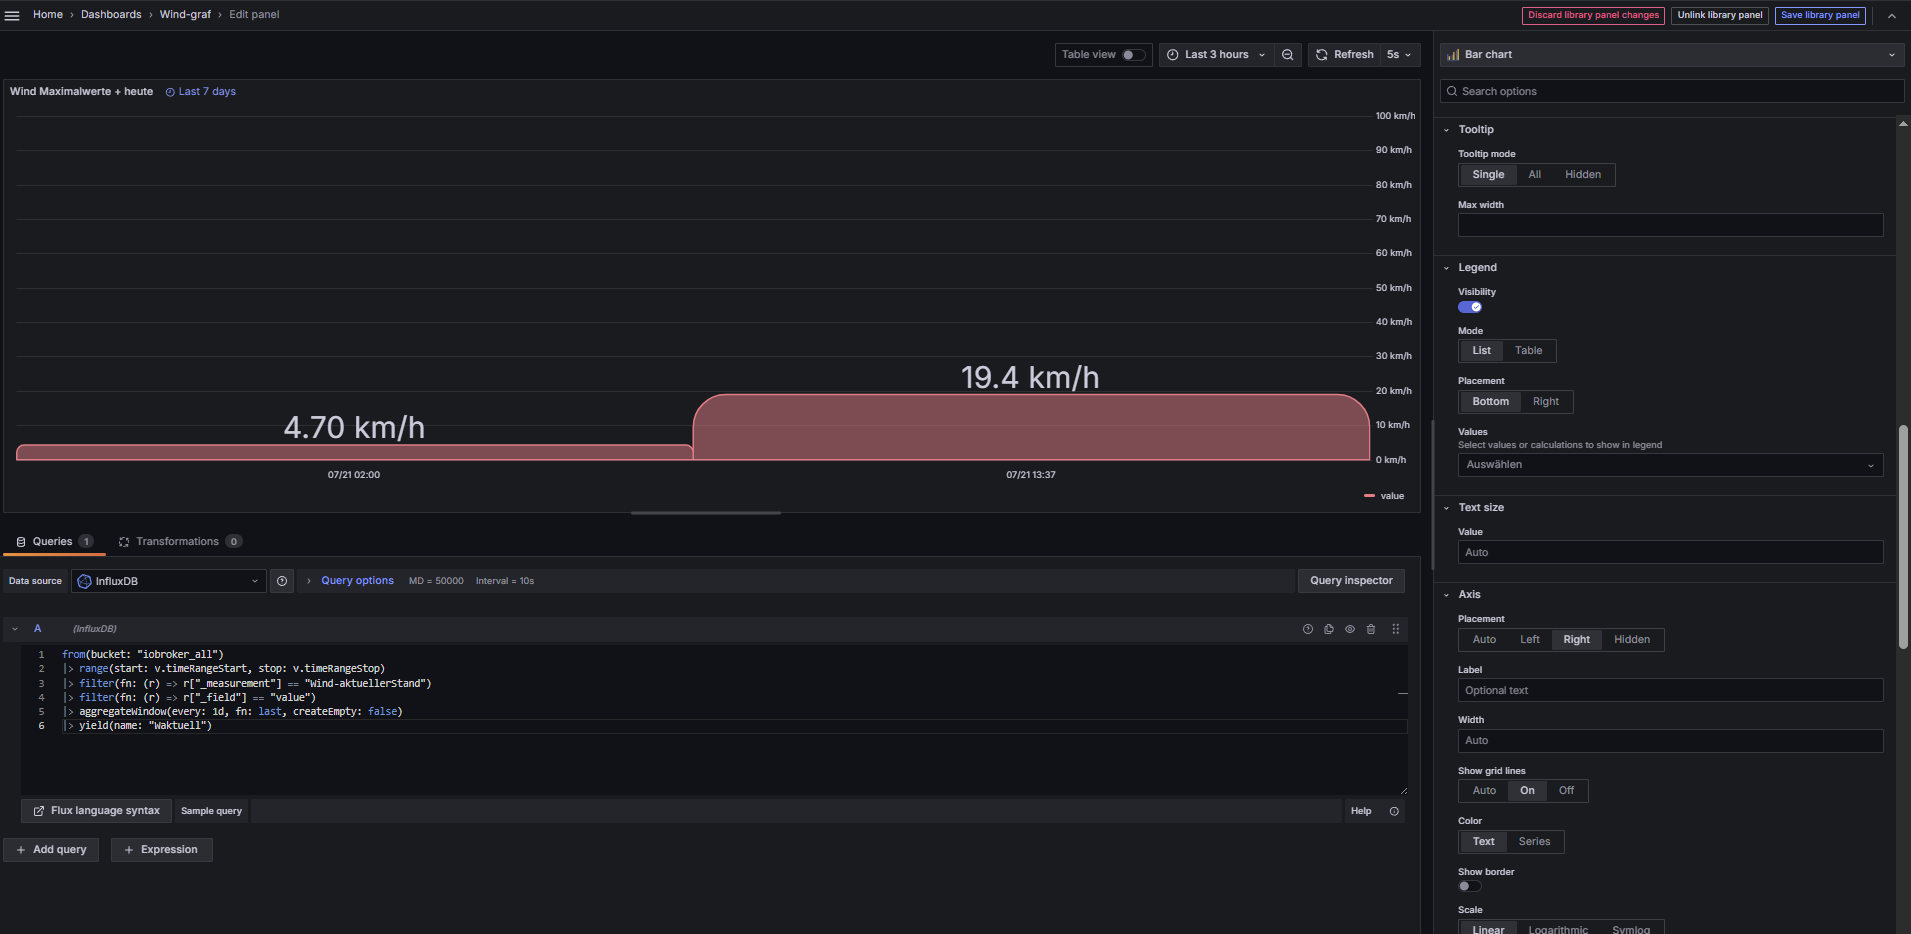
Reason: In the bar chart, the times were displayed as 2025-07-15 02:00:00, for example, but after removing them, they were displayed as 2025-07-15 23:58:00.
If I do the same for the second query, it looks as if all the values from the second query are displayed, not just the last and largest value.
I’ll continue testing and get back to you in a few days. I hope I’ve made myself clear and will now hand this over to the German-English translator.
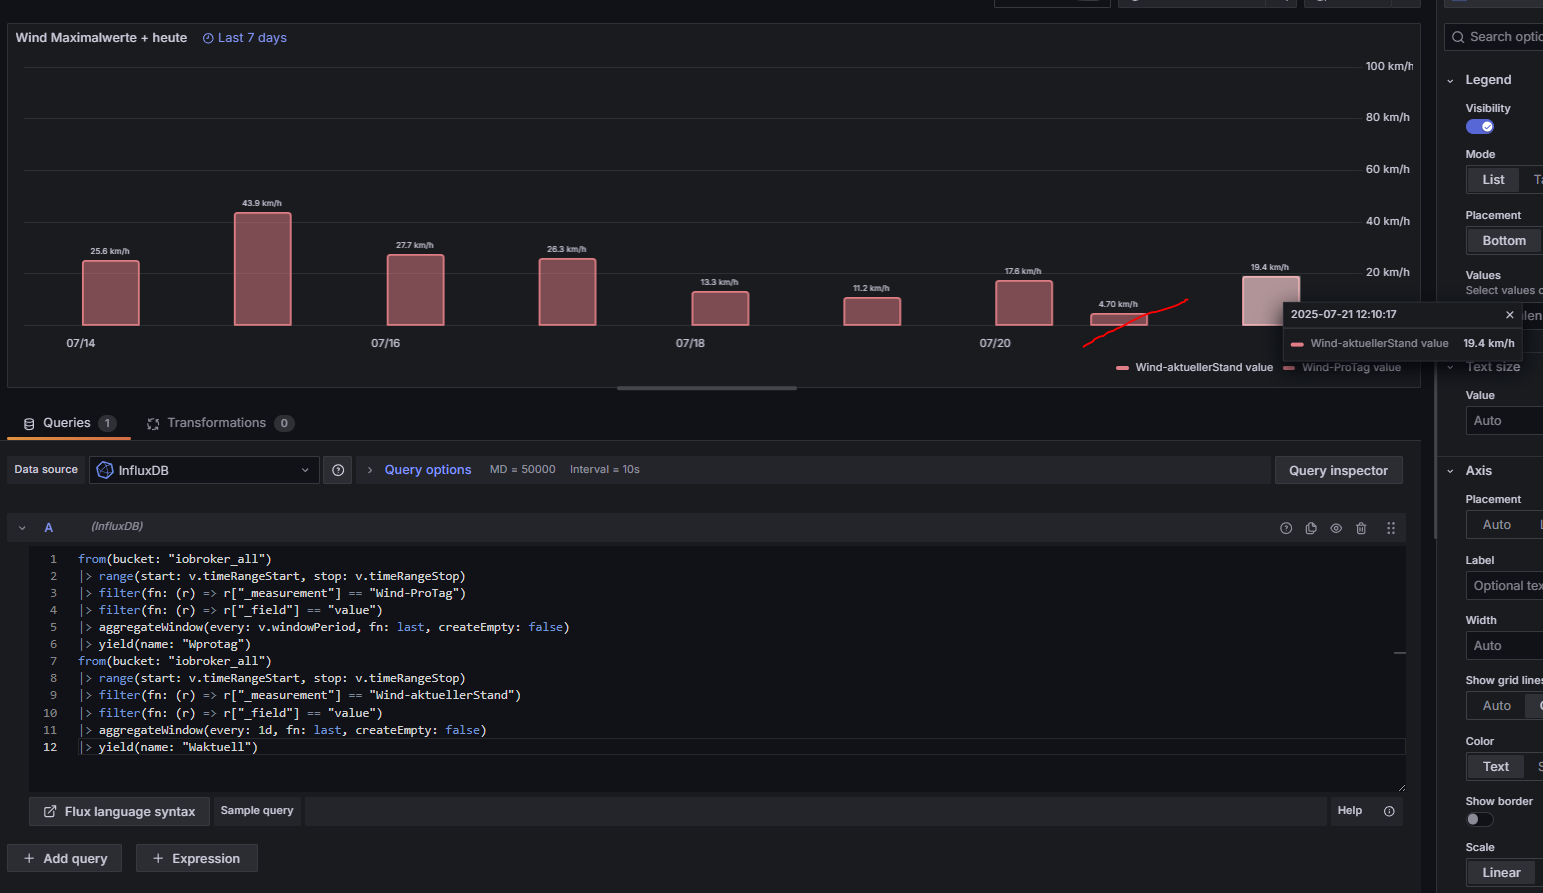
I also tried changing the color of the bar on the right for the current daily balance (Edit - Add fields override), but the colors are then changed for everything, even though I only select the relevant field.
A fundamental mistake I made was not paying attention to the time setting in influx (UTC).
I’m still having problems with that (see x-axis).
Thanks for the update, but have you tried creating 2 queries (A and B) instead of just one like you have done (A)? Not sure it will make any difference, but an easy thing to try.
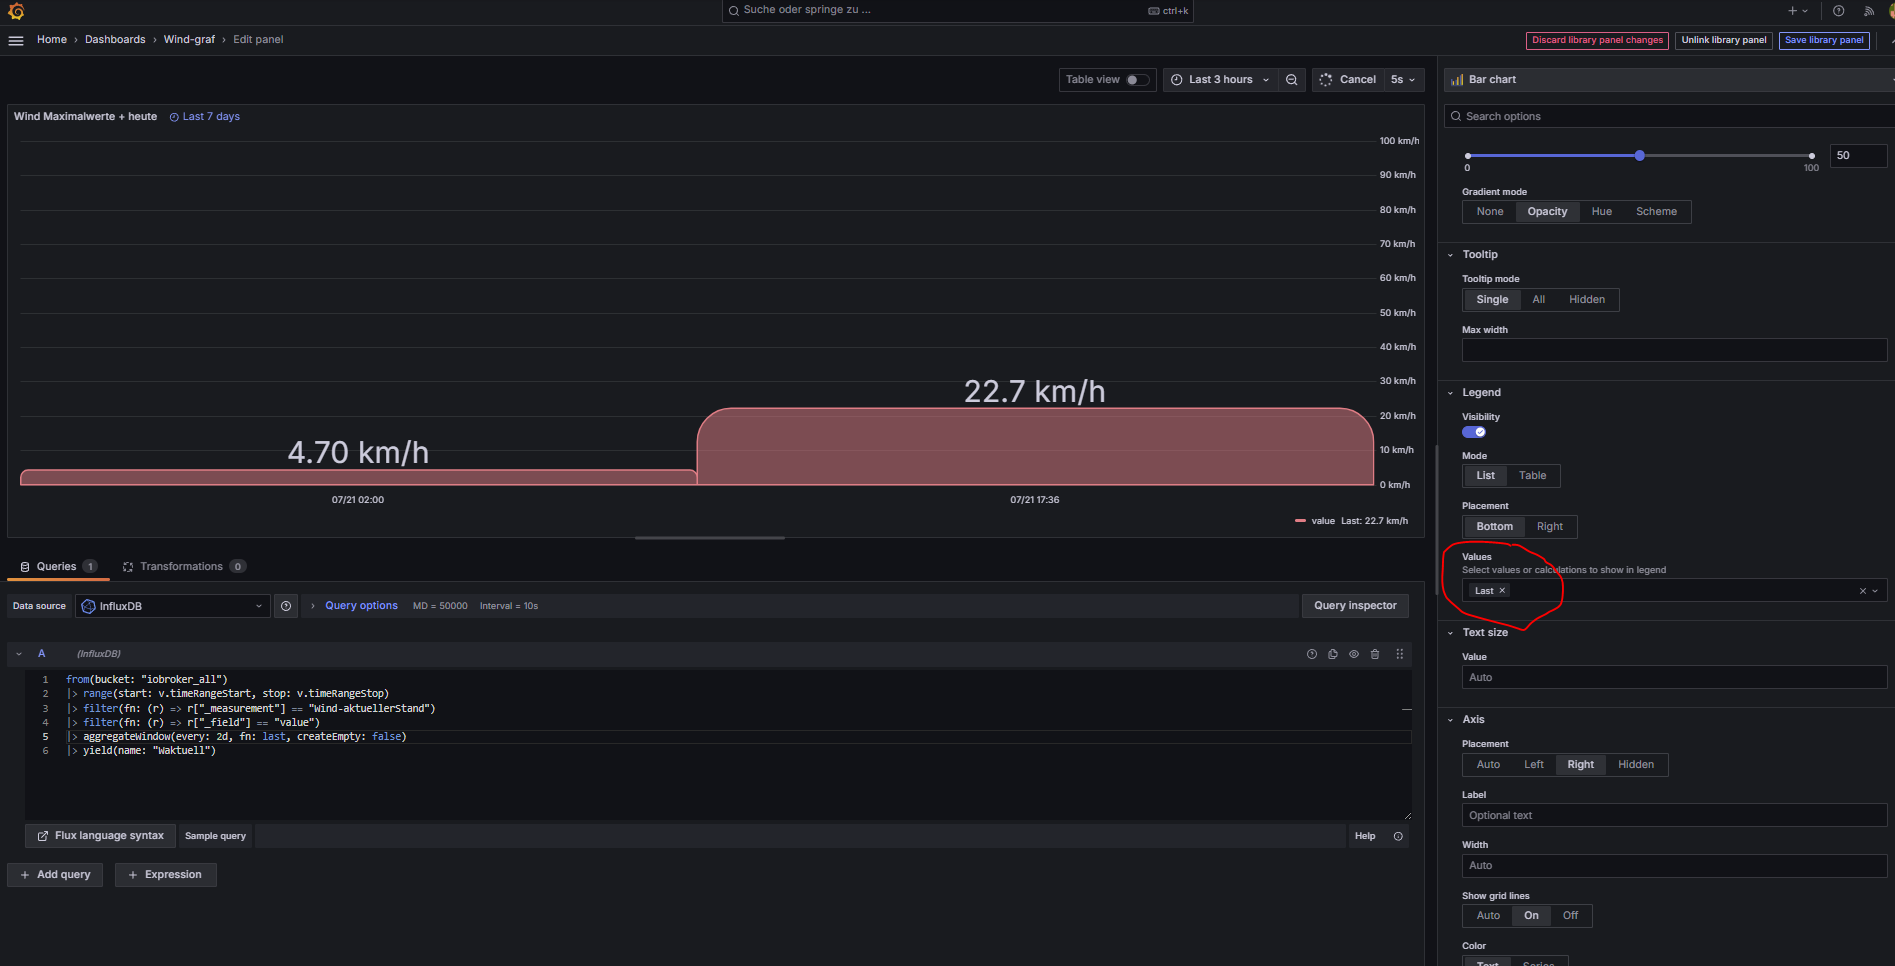
For the second query, what happens if you change this line to include ‘createEmpty: false’? |> aggregateWindow(every: 1d, fn: last, createEmpty: false)
That worked! Why did I miss that? It was already included in the first query.
This solves the problem, and I thank you very much for your help.
If you have time at some point: Is it possible to set a different color for the bar (the second query)? I had no success with “Add fields override.” If I set it to the second query, the color changes for all bars.
But that would only be for visual purposes and not really that important.
I thought it would be okay now, but the crossed-out bar shouldn’t appear. Only the last value (19.4) would be correct here. Only this bar should actually have a different color.