When “1d” is specified, a value with the time 02:00:00 is also displayed. This is not intended. I don’t know where this value comes from or why it is displayed for the current day.
If I change it to “2d,” this value is no longer displayed.
It might have to do with the timestamps in your data, time zone settings, etc. that make the 2nd value appear in your query. It is likely being caused by the aggregateWindow statement.
What happens if you put in an offset like this?
|> aggregateWindow(every: 1d, offset: -2h, fn: last, createEmpty: false)
It looks like I’ve found a solution.
The problem:
I have a weather station from Ecowitt. A lot of the weather station data goes into ioBroker, then into influxdb2. I wanted to display wind and rain in Grafana.
The following description refers to the wind data.
In Grafana, I now display the maximum wind speed values of the last 7 days in a dashboard (bar chart). Additionally, the same dashboard displays the maximum values for the current day and the currently measured values for the current day.
For this purpose, I created three data points (maximum wind speed of the last 7 days, maximum wind speed today, current wind speed today).
These three data points are populated in a Blockly script.
At the end of the day, the maximum measured value of the current day is transferred to the data point for the last 7 days.
At the start of the new day, the data point for the current day’s maximum value is deleted (“influx delete --org … --bucket … --start 1970-01-01T00:00:00Z --stop $(date +”%Y-%m-%dT%H:%M:%SZ") --predicate ‘_measurement=“Wmaxaktuell”’ --token …") and set to an initial value of 1.
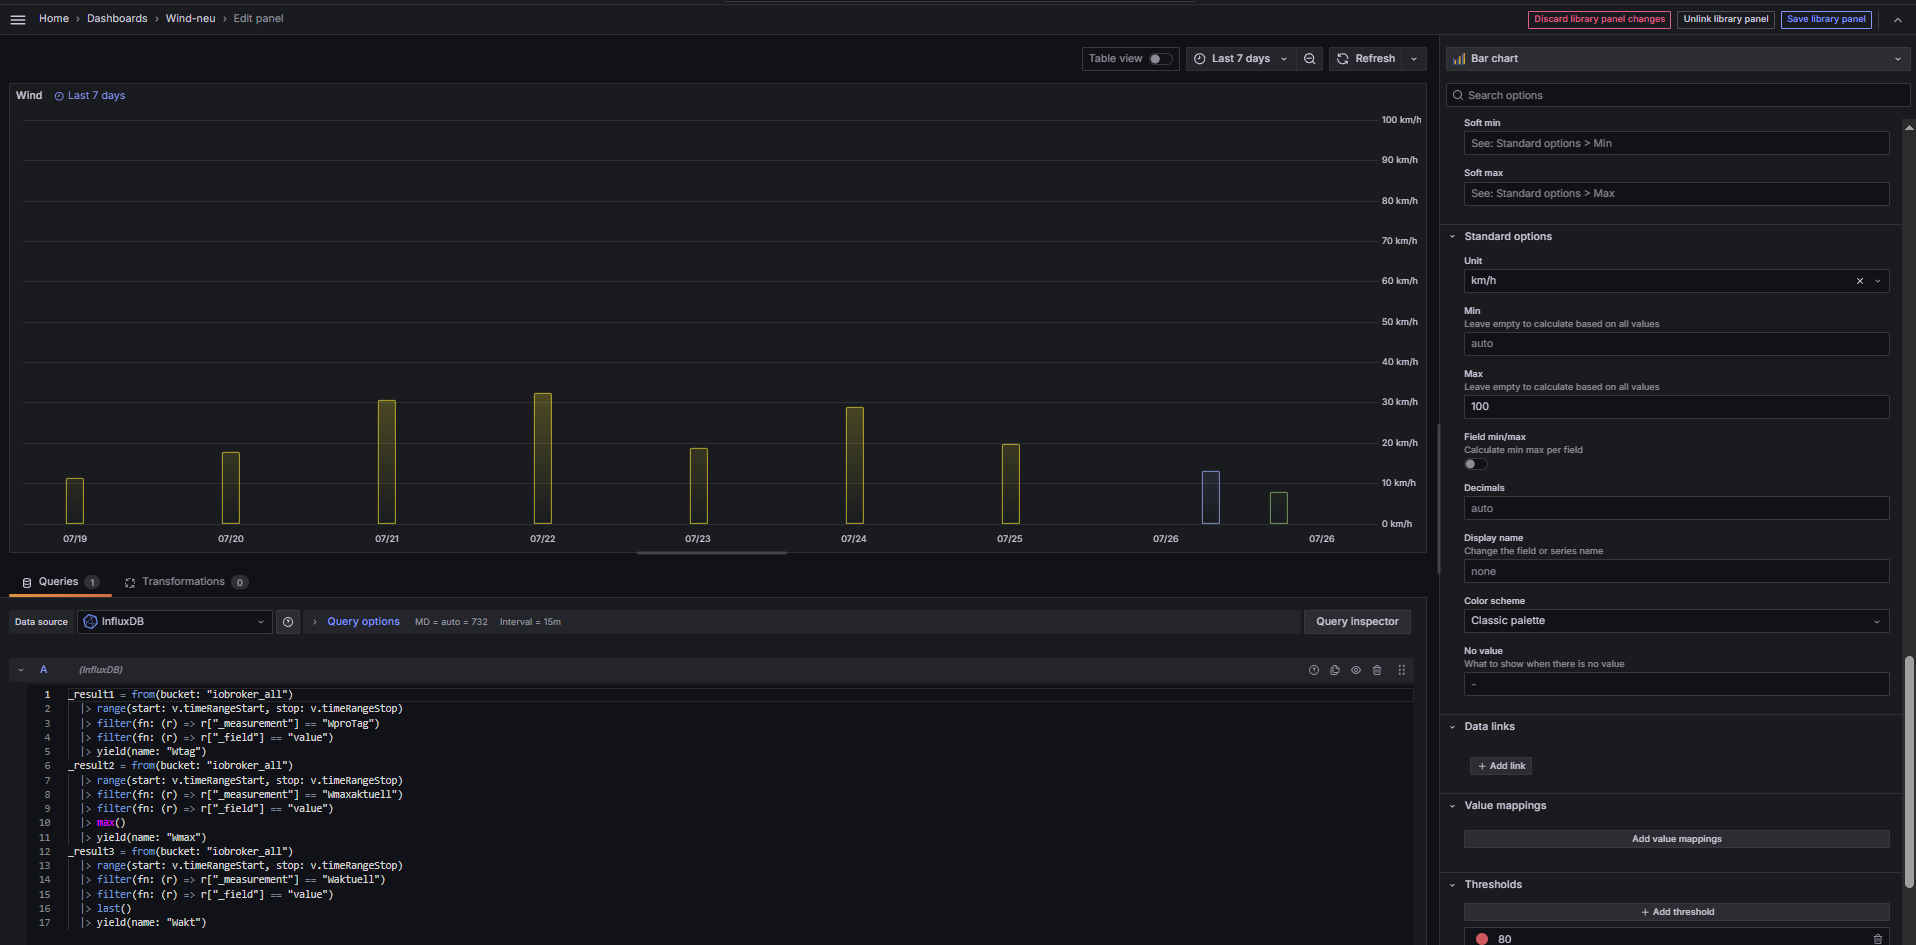
This is what it looks like now (edit mode):