Hello,
I’m using Influxdb 1.8.1 and Grafana 7.1.0 and try to use the influxdb with the new Flux QL. Therefore I’m created a new datasource and have created a query to get the same graph I already created with the normal Influx QL, what worked out fine witout any problems.
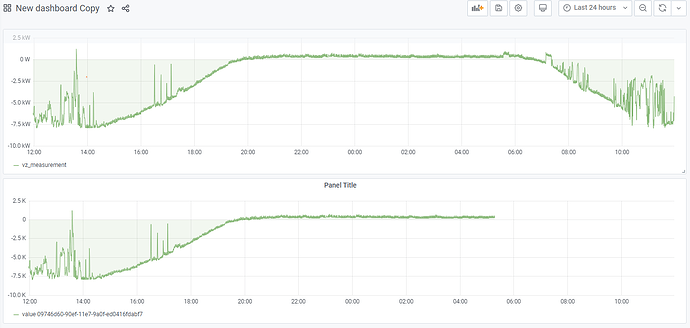
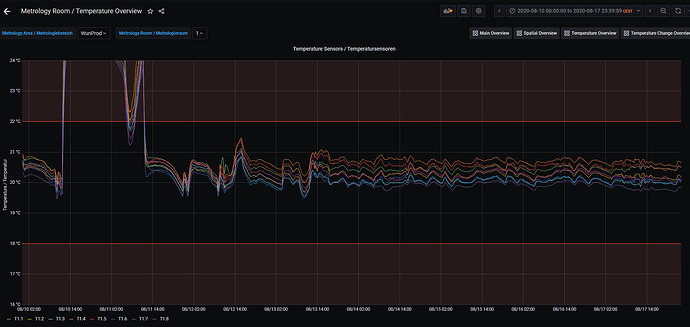
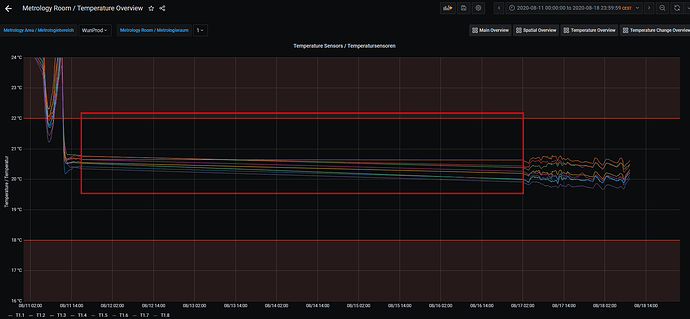
The problem is, when I now change the time range to e.g. last 24 hours, the graph based on Flux QL does not show all data points.
My assumption is that this behavoiur is related to the “Max Data Points” value, which is empty, but in gray the value of the possible points are mentioned.
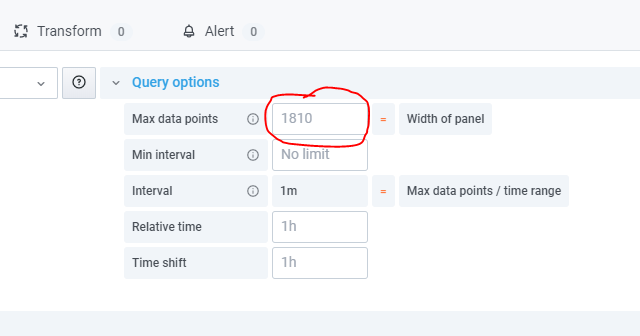
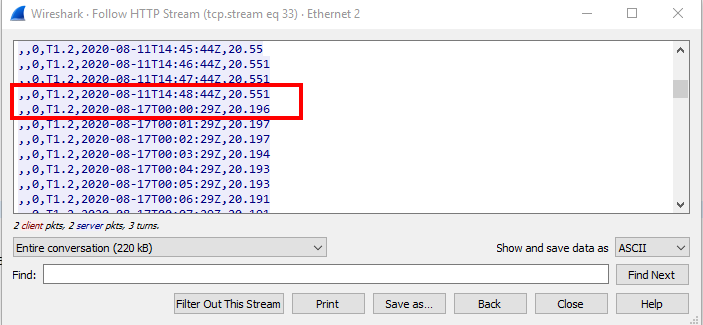
When I check the result with the Query Instpector, I get more than the mentioned 1810 values. When I change now, the “Max Data Points” value to the value I get with the Query Inspector I get all data points.
The question is, how can I always get all data points? Or is this a bug?
Br
Christian
