I am using timeseries panel with 3 queries from zabbix datasource. 2 of 3 queries are overriden with specific settings and expected view of panel looks like

Query inspector data when problem doesn’t exist can be found here
This panel has floating problem, that looks like this

Query inspector data when problem exists can be found here
What I mean with ‘floating’ - it can occur or not after dashboard refreshing. I can’t find the conditions when problem exists. Grafana debug logs and zabbix API logs don’t show errors when problem exists. And according to query inspector for both cases I see the 200 status and the batch of data.
It seems like grafana gets data from zabbix datasource, but can’t evaluate overrides for some reason (I may be wrong).
Dashboard is dynamic and panels are repeated for ‘rack’ variable - the problem can occur on some panels, when other look as expected

The problem exists randomly on different panels, and between dashboard refreshes can occur on panel where it didn’t occur before.
According to my observations, the problem arises when time interval in dashboard is less then ‘History Data storage period’ in zabbix housekeeping settings. In my setup it is 7d. So as I understand, when data from dashboard is retrieved from history tables - problem exists, when data for dashboard is retrieved from trend tables - problem doesn’t exist (at least I couldn’t reproduced it).
What I am expecting from community - I need advice on what else to check. I want to understand why grafana doesn’t draw panel as expected even when query returns 200 status and batch of data.
-
What Grafana version and what operating system are you using?
- Grafana 11.2.1 and alexanderzobnin-zabbix-datasource plugin 5.2.0
-
What I am trying to do:
- enable debug log in grafana to get more logs
- upgrade grafana to 11.4.6 and 12.1.0 (didn’t helpled)
- try to change dashboard settings like:
- apply overrides to ‘Fields with name’ and ‘Fields returned by query’
- changing ‘Max data points’ and ‘Min interval’ in data source query options
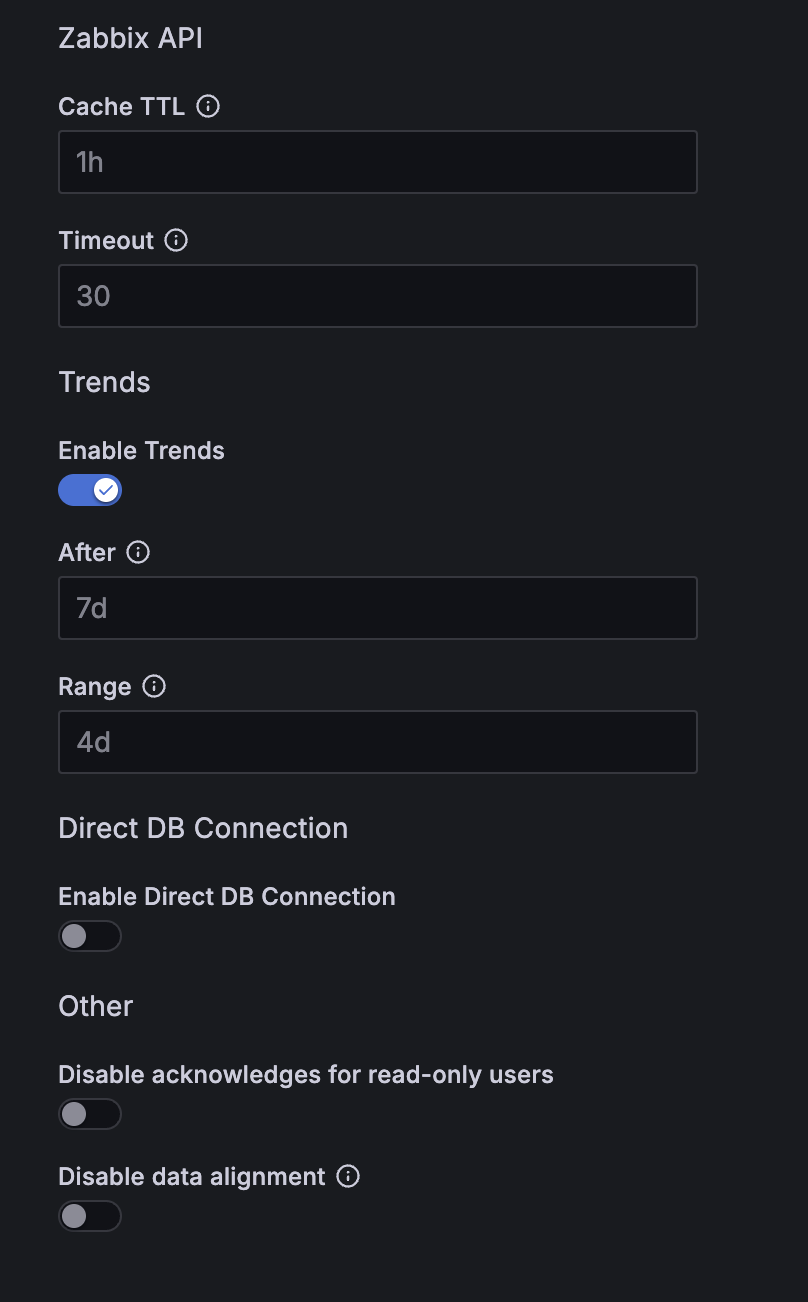
- chaning ‘trends’ interval in zabbix plugin settings - default 7d, when settings less values, I couldn’t reproduce problem
-
What did you expect to happen?
- I am expecting the panel always looks like on the first screen.
-
Can you copy/paste the configuration(s) that you are having problems with?
Dashboard json config
{
  "__inputs": [
    {
      "name": "DS_ZABBIX",
      "label": "Zabbix",
      "description": "",
      "type": "datasource",
      "pluginId": "alexanderzobnin-zabbix-datasource",
      "pluginName": "Zabbix"
    }
  ],
  "__elements": {},
  "__requires": [
    {
      "type": "datasource",
      "id": "alexanderzobnin-zabbix-datasource",
      "name": "Zabbix",
      "version": "5.2.0"
    },
    {
      "type": "grafana",
      "id": "grafana",
      "name": "Grafana",
      "version": "11.2.1"
    },
    {
      "type": "panel",
      "id": "timeseries",
      "name": "Time series",
      "version": ""
    }
  ],
  "annotations": {
    "list": [
      {
        "builtIn": 1,
        "datasource": {
          "type": "grafana",
          "uid": "-- Grafana --"
        },
        "enable": true,
        "hide": true,
        "iconColor": "rgba(0, 211, 255, 1)",
        "name": "Annotations & Alerts",
        "type": "dashboard"
      }
    ]
  },
  "editable": true,
  "fiscalYearStartMonth": 0,
  "graphTooltip": 0,
  "id": null,
  "links": [
    {
      "asDropdown": false,
      "icon": "external link",
      "includeVars": false,
      "keepTime": false,
      "tags": [],
      "targetBlank": true,
      "title": "Netbox Racks",
      "tooltip": "",
      "type": "link"
    }
  ],
  "panels": [
    {
      "collapsed": false,
      "gridPos": {
        "h": 1,
        "w": 24,
        "x": 0,
        "y": 0
      },
      "id": 130,
      "panels": [],
      "title": "Racks graphs",
      "type": "row"
    },
    {
      "datasource": {
        "type": "alexanderzobnin-zabbix-datasource",
        "uid": "${DS_ZABBIX}"
      },
      "fieldConfig": {
        "defaults": {
          "color": {
            "mode": "palette-classic-by-name"
          },
          "custom": {
            "axisBorderShow": true,
            "axisCenteredZero": false,
            "axisColorMode": "text",
            "axisLabel": "",
            "axisPlacement": "auto",
            "axisSoftMin": 0,
            "barAlignment": 0,
            "barWidthFactor": 1,
            "drawStyle": "line",
            "fillOpacity": 50,
            "gradientMode": "hue",
            "hideFrom": {
              "legend": false,
              "tooltip": false,
              "viz": false
            },
            "insertNulls": false,
            "lineInterpolation": "smooth",
            "lineStyle": {
              "fill": "solid"
            },
            "lineWidth": 0.5,
            "pointSize": 5,
            "scaleDistribution": {
              "type": "linear"
            },
            "showPoints": "auto",
            "spanNulls": true,
            "stacking": {
              "group": "A",
              "mode": "none"
            },
            "thresholdsStyle": {
              "mode": "off"
            }
          },
          "displayName": "Power consumption",
          "fieldMinMax": false,
          "mappings": [],
          "thresholds": {
            "mode": "absolute",
            "steps": [
              {
                "color": "green",
                "value": null
              }
            ]
          },
          "unit": "watt"
        },
        "overrides": [
          {
            "matcher": {
              "id": "byName",
              "options": "Yellow zone power limit"
            },
            "properties": [
              {
                "id": "custom.lineWidth",
                "value": 2
              },
              {
                "id": "custom.fillOpacity",
                "value": 0
              },
              {
                "id": "displayName",
                "value": "Yellow zone power limit"
              },
              {
                "id": "color",
                "value": {
                  "fixedColor": "dark-yellow",
                  "mode": "fixed"
                }
              }
            ]
          },
          {
            "matcher": {
              "id": "byName",
              "options": "Red zone power limit"
            },
            "properties": [
              {
                "id": "custom.lineWidth",
                "value": 2
              },
              {
                "id": "custom.fillOpacity",
                "value": 0
              },
              {
                "id": "displayName",
                "value": "Red zone power limit"
              },
              {
                "id": "color",
                "value": {
                  "fixedColor": "dark-red",
                  "mode": "fixed"
                }
              }
            ]
          }
        ]
      },
      "gridPos": {
        "h": 8,
        "w": 12,
        "x": 0,
        "y": 1
      },
      "id": 1,
      "links": [
        {
          "targetBlank": true,
          "title": "Grafana $rack PDUs dashboard",
          "url": "/d/ceoj9d2hym03kd/pdu?orgId=1&var-site=${site}&var-location=${location}&var-rack=${rack}&from=now-24h&to=now"
        }
      ],
      "maxPerRow": 2,
      "options": {
        "legend": {
          "calcs": [
            "max",
            "min",
            "mean"
          ],
          "displayMode": "table",
          "placement": "bottom",
          "showLegend": true
        },
        "tooltip": {
          "mode": "multi",
          "sort": "desc"
        }
      },
      "pluginVersion": "11.2.1",
      "repeat": "rack",
      "repeatDirection": "h",
      "targets": [
        {
          "application": {
            "filter": ""
          },
          "countTriggersBy": "",
          "datasource": {
            "type": "alexanderzobnin-zabbix-datasource",
            "uid": "${DS_ZABBIX}"
          },
          "evaltype": "0",
          "functions": [],
          "group": {
            "filter": "Racks"
          },
          "host": {
            "filter": "$rack"
          },
          "item": {
            "filter": "Power consumption"
          },
          "itemTag": {
            "filter": ""
          },
          "macro": {
            "filter": ""
          },
          "options": {
            "count": false,
            "disableDataAlignment": false,
            "showDisabledItems": false,
            "skipEmptyValues": false,
            "useTrends": "default",
            "useZabbixValueMapping": false
          },
          "proxy": {
            "filter": ""
          },
          "queryType": "0",
          "refId": "consumption",
          "resultFormat": "time_series",
          "schema": 12,
          "table": {
            "skipEmptyValues": false
          },
          "tags": {
            "filter": ""
          },
          "textFilter": "",
          "trigger": {
            "filter": ""
          }
        },
        {
          "application": {
            "filter": ""
          },
          "countTriggersBy": "",
          "datasource": {
            "type": "alexanderzobnin-zabbix-datasource",
            "uid": "${DS_ZABBIX}"
          },
          "evaltype": "0",
          "functions": [],
          "group": {
            "filter": "Racks"
          },
          "hide": false,
          "host": {
            "filter": "$rack"
          },
          "item": {
            "filter": "Yellow zone power limit"
          },
          "itemTag": {
            "filter": ""
          },
          "macro": {
            "filter": ""
          },
          "options": {
            "count": false,
            "disableDataAlignment": false,
            "showDisabledItems": false,
            "skipEmptyValues": false,
            "useTrends": "default",
            "useZabbixValueMapping": false
          },
          "proxy": {
            "filter": ""
          },
          "queryType": "0",
          "refId": "yellow_limit",
          "resultFormat": "time_series",
          "schema": 12,
          "table": {
            "skipEmptyValues": false
          },
          "tags": {
            "filter": ""
          },
          "textFilter": "",
          "trigger": {
            "filter": ""
          }
        },
        {
          "application": {
            "filter": ""
          },
          "countTriggersBy": "",
          "datasource": {
            "type": "alexanderzobnin-zabbix-datasource",
            "uid": "${DS_ZABBIX}"
          },
          "evaltype": "0",
          "functions": [],
          "group": {
            "filter": "Racks"
          },
          "hide": false,
          "host": {
            "filter": "$rack"
          },
          "item": {
            "filter": "Red zone power limit"
          },
          "itemTag": {
            "filter": ""
          },
          "macro": {
            "filter": ""
          },
          "options": {
            "count": false,
            "disableDataAlignment": false,
            "showDisabledItems": false,
            "skipEmptyValues": false,
            "useTrends": "default",
            "useZabbixValueMapping": false
          },
          "proxy": {
            "filter": ""
          },
          "queryType": "0",
          "refId": "red_limit",
          "resultFormat": "time_series",
          "schema": 12,
          "table": {
            "skipEmptyValues": false
          },
          "tags": {
            "filter": ""
          },
          "textFilter": "",
          "trigger": {
            "filter": ""
          }
        }
      ],
      "title": "$rack",
      "type": "timeseries"
    }
  ],
  "refresh": "auto",
  "schemaVersion": 39,
  "tags": [],
  "templating": {
    "list": [
      {
        "current": {},
        "datasource": {
          "type": "alexanderzobnin-zabbix-datasource",
          "uid": "${DS_ZABBIX}"
        },
        "definition": "Zabbix - host",
        "hide": 0,
        "includeAll": false,
        "label": "site",
        "multi": false,
        "name": "site",
        "options": [],
        "query": {
          "application": "",
          "group": "Sites",
          "host": "/.+/",
          "item": "",
          "itemTag": "",
          "queryType": "host"
        },
        "refresh": 1,
        "regex": "",
        "skipUrlSync": false,
        "sort": 0,
        "type": "query"
      },
      {
        "current": {},
        "datasource": {
          "type": "alexanderzobnin-zabbix-datasource",
          "uid": "${DS_ZABBIX}"
        },
        "definition": "Zabbix - host",
        "hide": 0,
        "includeAll": false,
        "label": "location",
        "multi": false,
        "name": "location",
        "options": [],
        "query": {
          "application": "",
          "group": "Locations",
          "host": "/$site:.+/",
          "item": "",
          "itemTag": "",
          "queryType": "host"
        },
        "refresh": 1,
        "regex": "(.+)",
        "skipUrlSync": false,
        "sort": 0,
        "type": "query"
      },
      {
        "current": {},
        "datasource": {
          "type": "alexanderzobnin-zabbix-datasource",
          "uid": "${DS_ZABBIX}"
        },
        "definition": "Zabbix - host",
        "hide": 0,
        "includeAll": true,
        "label": "rack",
        "multi": true,
        "name": "rack",
        "options": [],
        "query": {
          "application": "",
          "group": "Racks",
          "host": "/$location:.+/",
          "item": "",
          "itemTag": "",
          "queryType": "host"
        },
        "refresh": 1,
        "regex": "",
        "skipUrlSync": false,
        "sort": 0,
        "type": "query"
      }
    ]
  },
  "time": {
    "from": "now-24h",
    "to": "now"
  },
  "timepicker": {},
  "timezone": "browser",
  "title": "Racks",
  "uid": "beoj8fhoi2j9cd",
  "version": 50,
  "weekStart": ""
}
Here is screenshot of zabbix plugin settings
-
Did you receive any errors in the Grafana UI or in related logs? If so, please tell us exactly what they were.
- No, there are any errors in grafana logs, zabbix API logs, zabbix database logs.
-
Did you follow any online instructions? If so, what is the URL?
- No, because I didn’t found appropriate cases when googling.