Hello there o/
Someone, please, can help me understanding a problem with the Table Panel (Official one)?
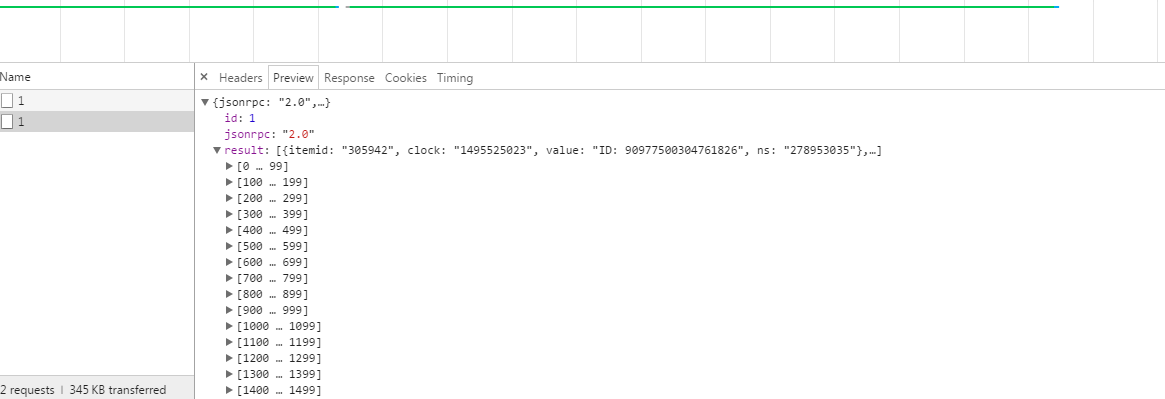
From time to time I have this

The datasource is Zabbix.
The data at Zabbix is fine
The type of data is text (its a log monitoring, where I want to show in grafana the pieces where an error is found)
The grafana version is 4.2.0
Why I keep getting NaN even with data? ![]()
Config of the table