-
What Grafana version and what operating system are you using?
Linux, Grafana v9.3.2 -
What are you trying to achieve?
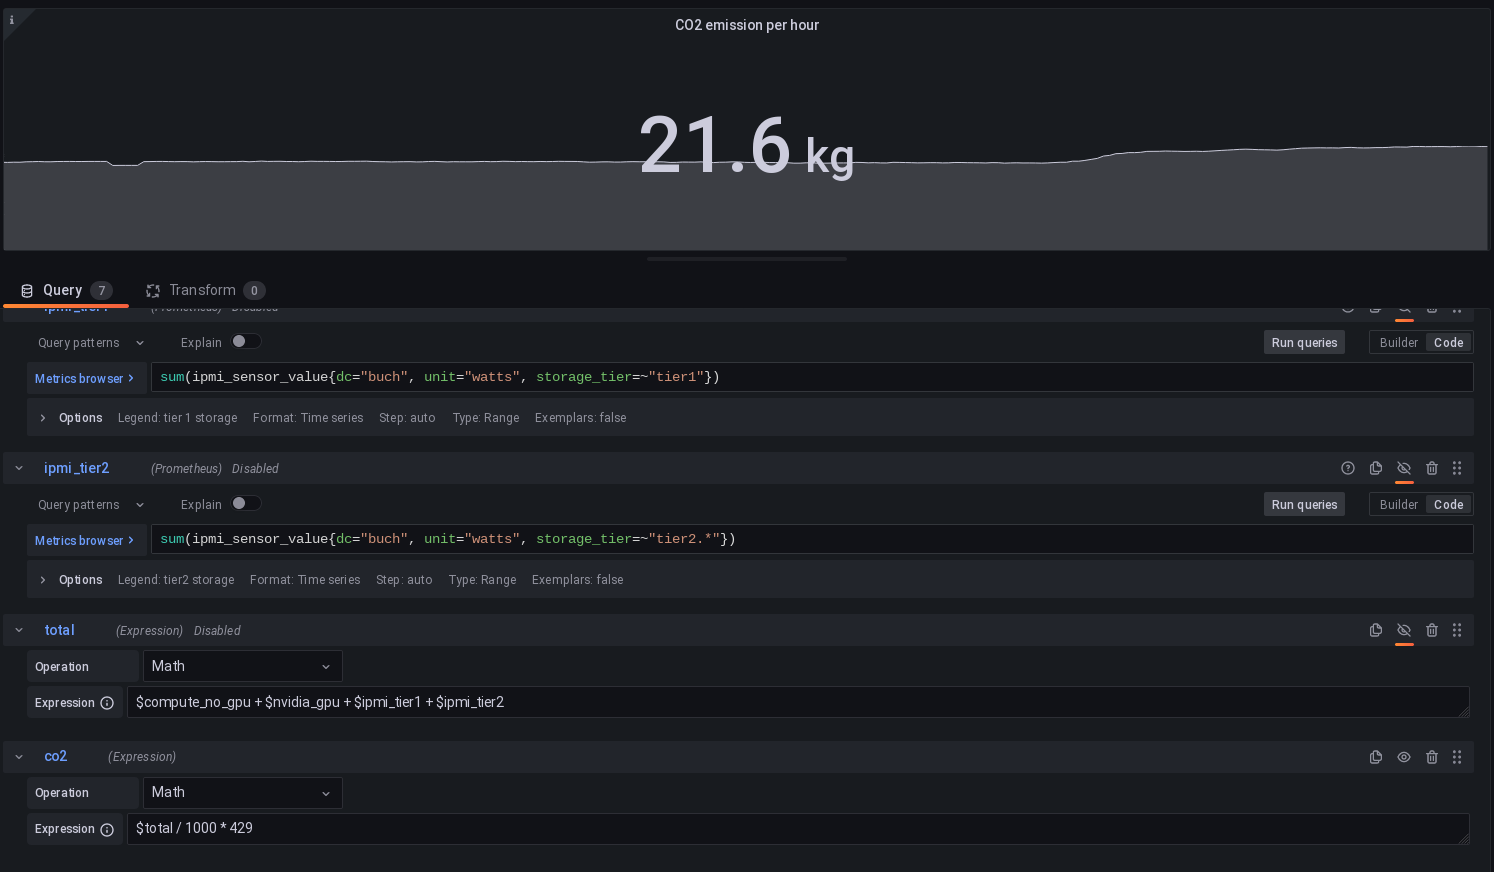
I have a public dashboard with a panel that displays an expression. The expression refers to prometheus queries that are hidden (I’m combining a couple of the query results in the expression). I only want to show the expression to show in the dashboard. -
How are you trying to achieve it?
I think the above explains it. Below is a screenshot.
-
What happened?
I see “no data” in the publically exported dashboard. Other panels work well.
I see the following errors in the logs
logger=publicdashboards.service t=2023-01-03T15:50:57.8934737Z level=error msg="Error querying datasources for public dashboard" error="expression request error: unable to find dependent node 'ipmi_compute'" datasources="[__expr__ prometheus]"
-
What did you expect to happen?
I would like to see the expression as it displays in the non-public dashboard.
-
Can you copy/paste the configuration(s) that you are having problems with?
Please tell me what else you need. -
Did you receive any errors in the Grafana UI or in related logs? If so, please tell us exactly what they were.
Logs see above. -
Did you follow any online instructions? If so, what is the URL?
No.