-
What Grafana version and what operating system are you using?
9.5.2 -
What are you trying to achieve?
Displaying the error message (query error) once providing the wrong PromQL as in previous version (8.5.21) -
How are you trying to achieve it?
Upgrade/Use version 9.5.2, go to explorer with an instance of Prometheus as the data source then set type with both, provide the wrong query such as* invalid{} -
What happened?
There is no error message appeared. -
What did you expect to happen?
It should appear Query Error as in previous version (8.5.21). -
Can you copy/paste the configuration(s) that you are having problems with?
No, since It’s not related to the configuration. -
Did you receive any errors in the Grafana UI or in related logs? If so, please tell us exactly what they were.
The error not shown in version 9.5.2
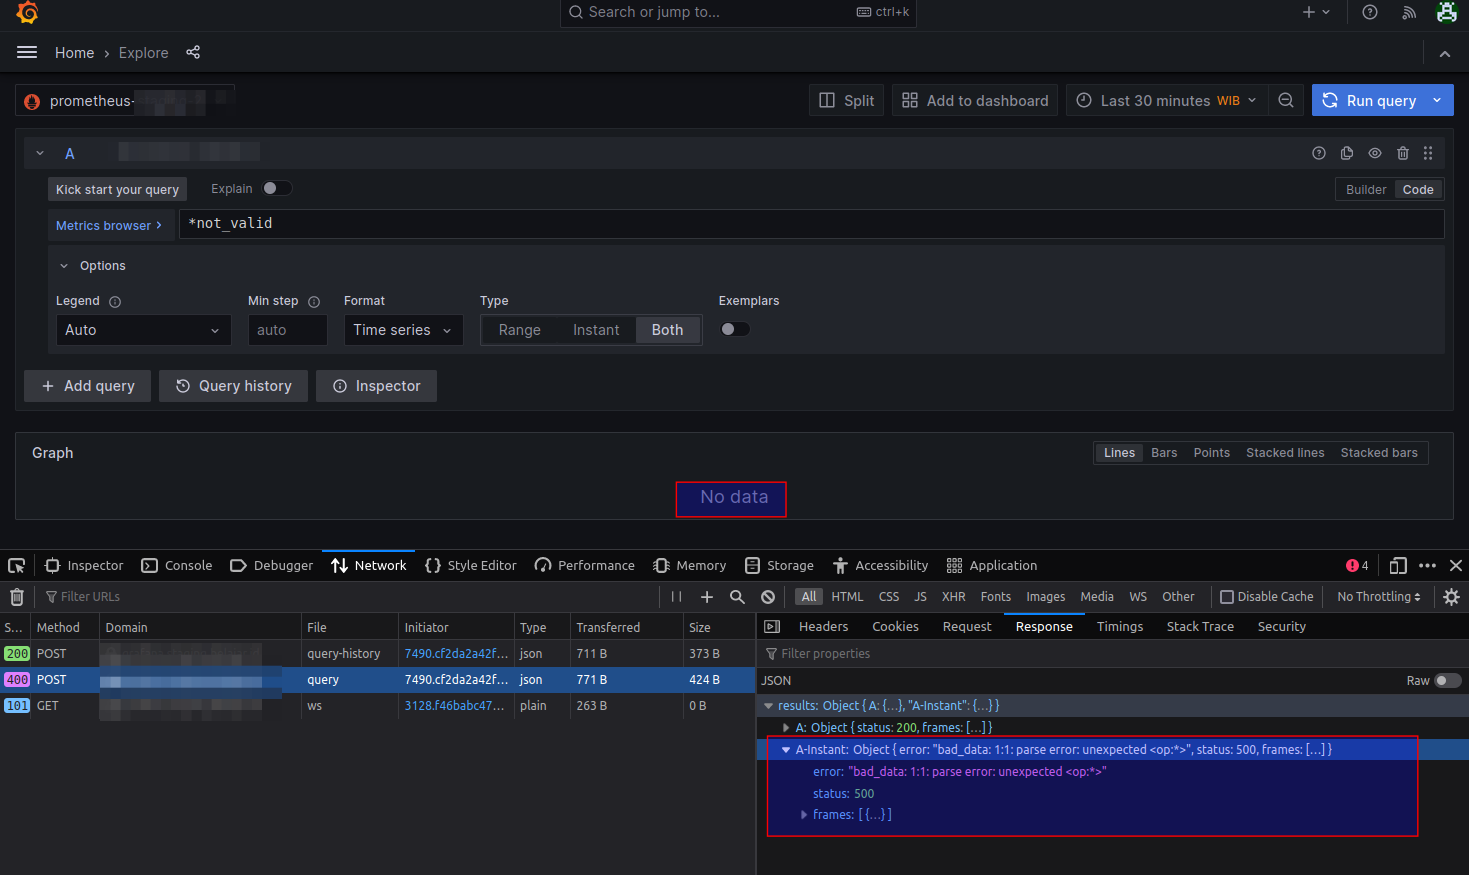
If we provide the other query with an alias by the same name with appended with -Instant then the error will be attach to it.

But with the same test, the error is appeared in older version (8.5.21).

- Did you follow any online instructions? If so, what is the URL?
So far i’m not find the exact same error reported.